Tirone levels and quadrant lines
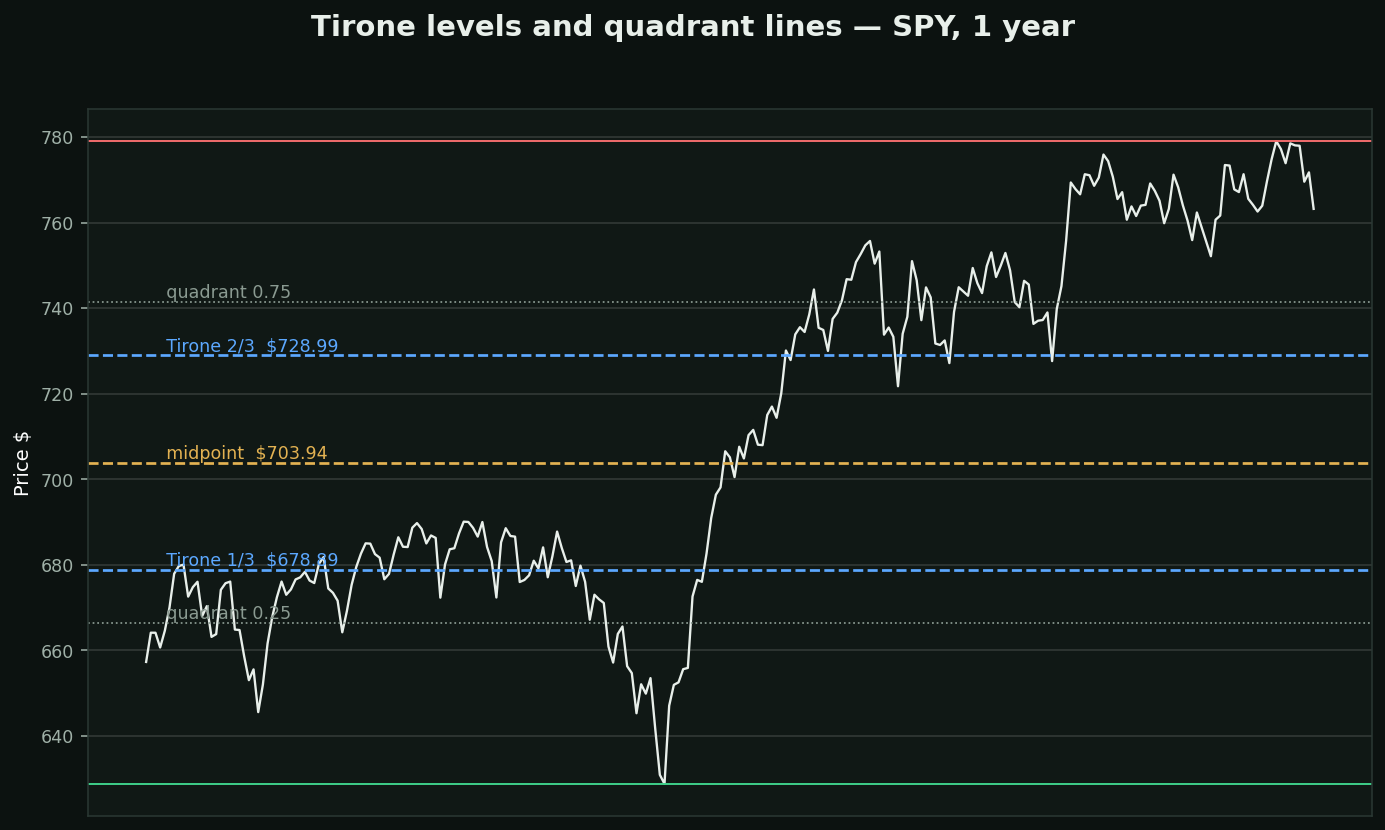
What they are: take the highest high and lowest low of a period and cut the range into pieces. Tirone cuts into thirds; quadrant lines cut into quarters. That is the whole method.
Why they belong in this set: they are the CONTROL GROUP. Every other tool on this palette adds something — a sequence, an angle, a pattern, a wave count — on top of 'divide the range'. These add nothing, and that makes them the fair comparison.
And that comparison has been run. anomaly_scanner tested Fibonacci retracement levels on SPY against control levels at 0.30, 0.45, 0.55 and 0.70 — arithmetic divisions with no theory behind them. Price reversed at the Fibonacci levels 31% of the time and at the plain ones 33%.
The plain levels did slightly better. Not significantly better — the honest reading is that the two are indistinguishable — but that IS the finding: the sequence is not adding anything you could measure.
What that leaves you with: range division genuinely is useful. Knowing whether price sits in the top or bottom third of its year is real information. You do not need a sequence from the 13th century to divide by three.