The trendline
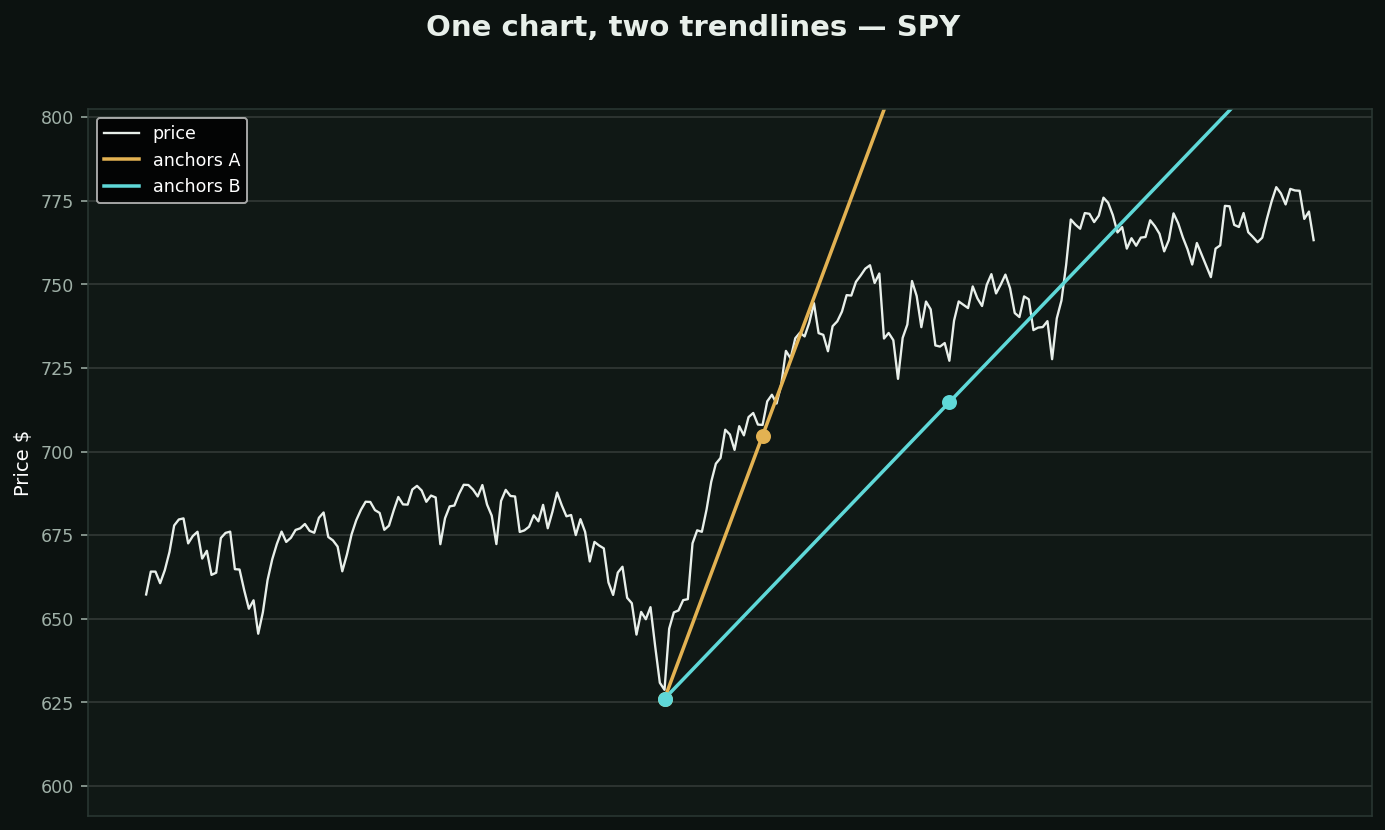
What it is: the first thing anyone draws. Two points, a straight line, and a story about support or resistance.
Look at the chart. Both lines connect real swing lows on the same stock over the same year. Both are the kind of line you would draw without hesitating. Today they disagree about where support is by $318.75 — one says the trend is intact, the other says it broke weeks ago.
Nothing on that chart tells you which is correct, because correctness is not a property a trendline has. You picked the points; the line is your opinion drawn straight.
What it is genuinely good for:
• Seeing the SHAPE of a move — higher lows really are higher lows
• Marking a level you will act on, decided in advance
• Talking to someone else about the same chart
What it cannot do: be tested. There is no rule to backtest, so nobody — including the person who drew it — can tell you its hit rate. Every claim about trendline accuracy you have ever read was measured on lines chosen after the fact.