ADX (trend strength)
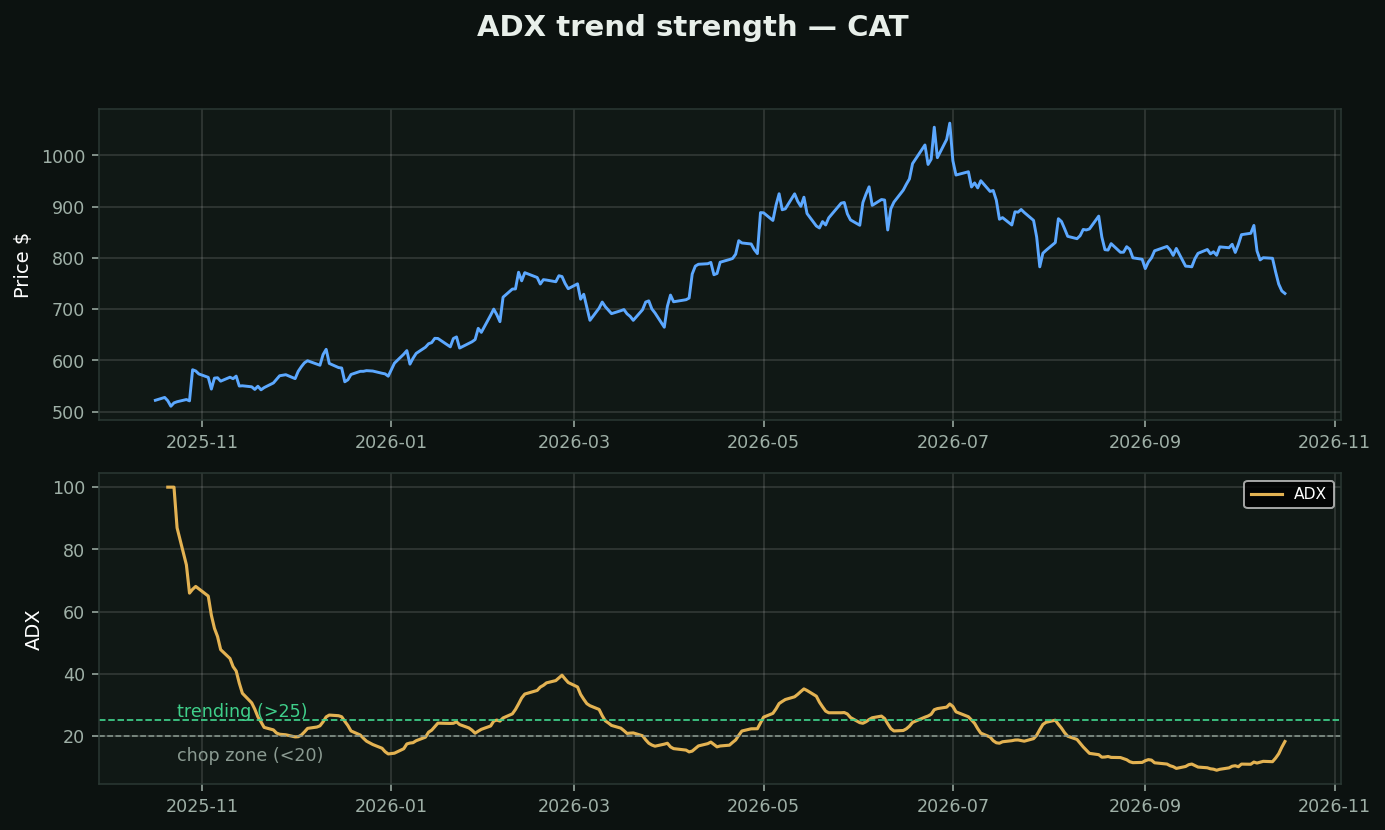
What it is: a 0-100 gauge of how STRONGLY price is trending — in either direction. It doesn't tell you up or down; it tells you whether there IS a trend.
How to read it:
• Above 25 = real trend in force — trend-following tools (MAs, MACD) work
• Below 20 = chop — mean-reversion tools (RSI, Bollinger) work; trend tools whipsaw
• ADX *rising* through 25 = a new trend being born
Why it might be the most underrated indicator: most losses come from using the right tool in the wrong regime. ADX is the regime detector — it tells you WHICH of your other indicators to trust today.