Money Flow Index
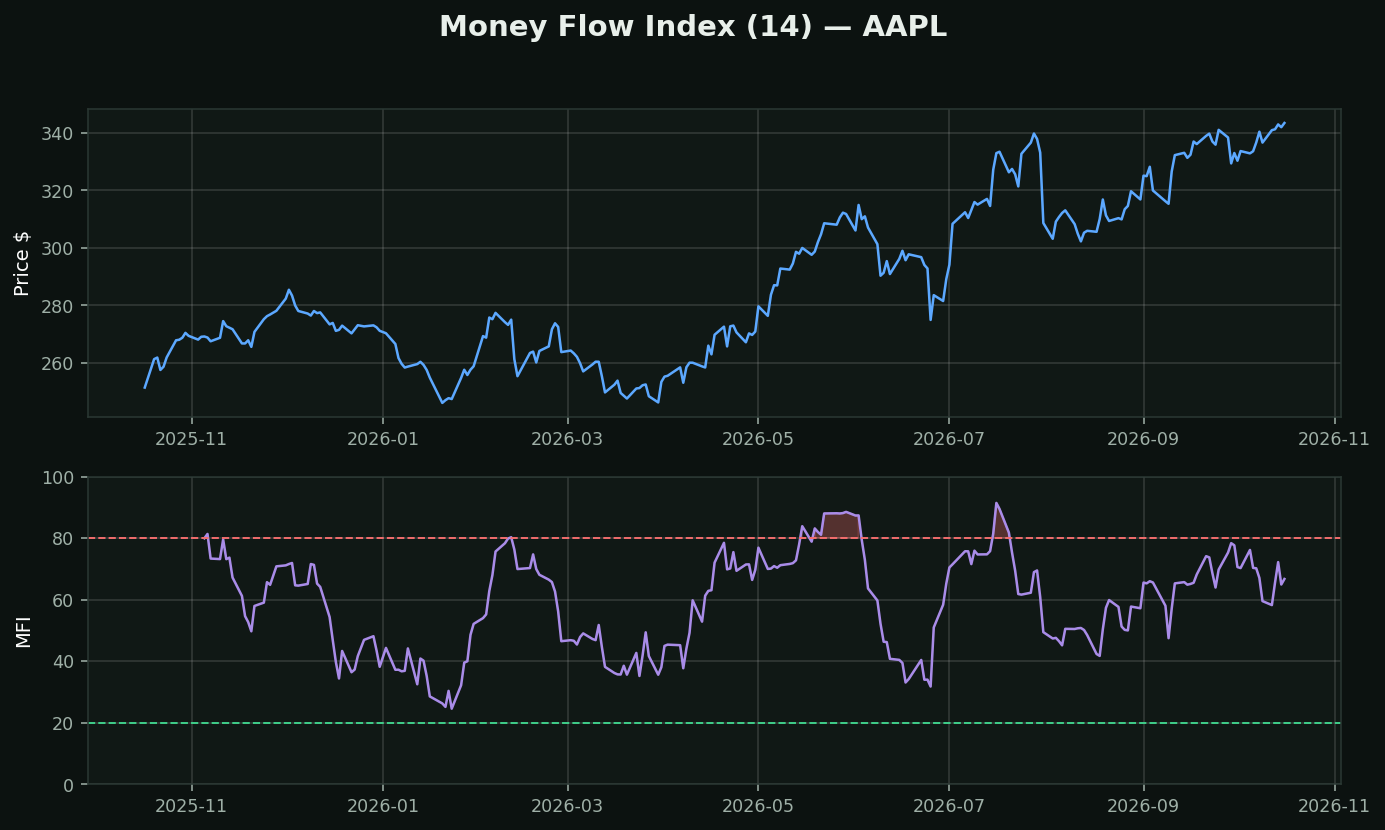
What it is: RSI with volume bolted on. Same 0–100 scale, same oversold/overbought idea, but each day's move is weighted by how much stock traded. Often called *volume-weighted RSI*.
Why that matters: RSI treats a 2% drop on record volume the same as a 2% drop on a holiday half-session. MFI does not. A stock can be RSI-oversold on drifting, apathetic selling — that is different from oversold on capitulation volume, and only MFI can tell them apart.
How traders use it:
• MFI below 20 → selling is exhausted *and* it was real selling
• MFI above 80 → buying is stretched and heavily participated
• Divergence — price makes a new low, MFI does not — is the highest-value read here: the second leg down came on less money
What testing here found: MFI belongs to the RSI family, and RSI is one of the few technical signals in this toolkit that survived its own test — oversold names beat the base rate by +0.82% over 21 days (t=+4.09, 413,946 stock-days) and overbought trailed by -0.58% (t=-4.27). The contrarian read holds.