Linear Regression: slope and R²
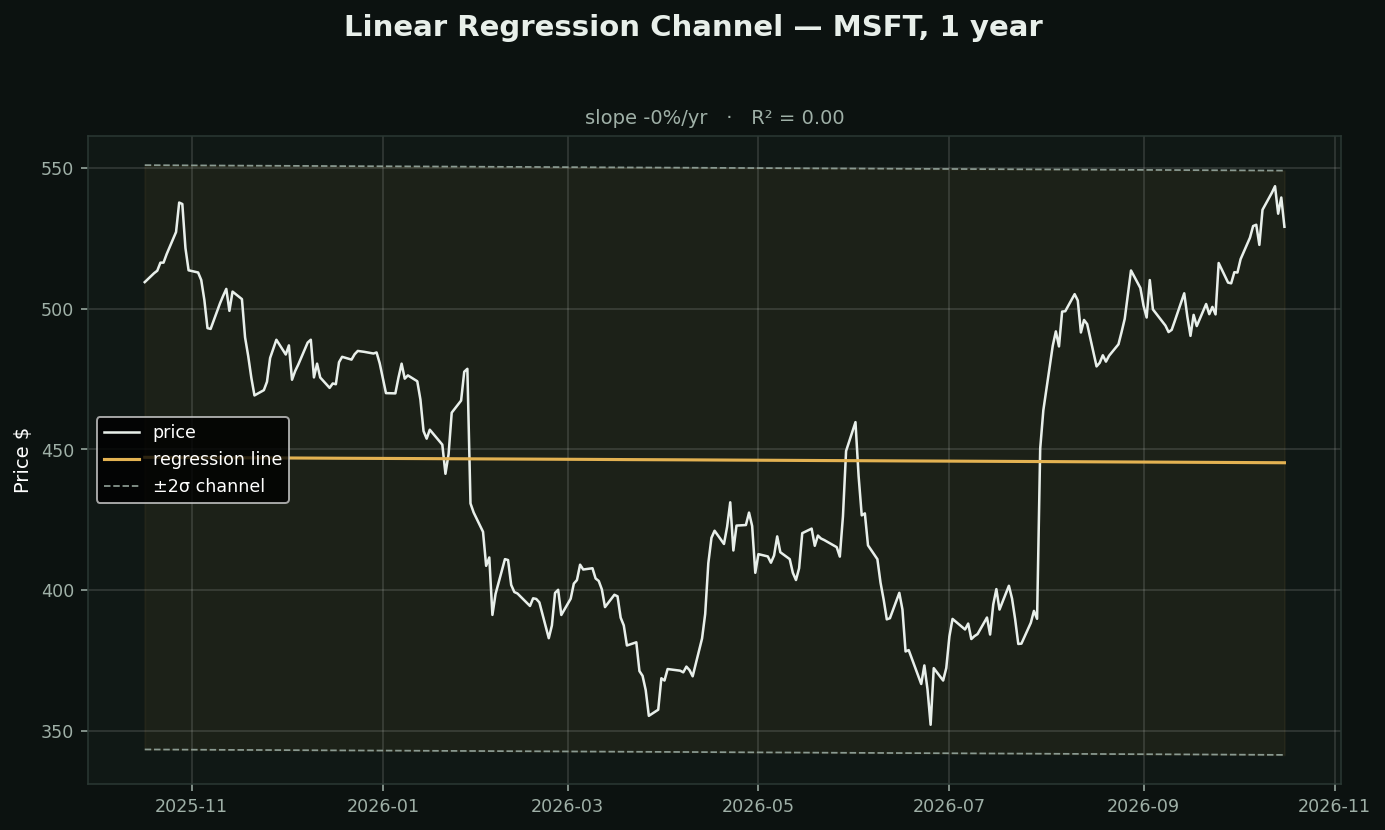
What it is: the straight line of best fit through price. Your study library splits it into four separate entries — Slope, Intercept, R², Forecast — but they are one calculation.
The two numbers that matter:
• Slope = how fast, and which way. A trend's speed, in dollars per day or annualised as a percent
• R² = how STRAIGHT. 0 to 1. This is the number almost nobody looks at, and it is the important one
Why R² changes the picture: two stocks can both be up 30% on the year. One climbed in a near-straight line (R² 0.90); the other round-tripped twice and finished up (R² 0.20). Every moving average, MACD and trend score treats those as the same trend. They are not the same stock, and they are not the same risk.
How traders use it: the ±2σ channel around the line is a statistically-grounded version of what people draw by eye — with the advantage that it cannot be drawn two different ways by two people.
Chart: MSFT at -0%/yr with R² = 0.00. Time Series Forecast and Linear Reg Forecast are this same line extended forward — an extrapolation, not a prediction.
What testing here found: this is a trend-following tool, and that family did not survive its own test. Over 413,946 stock-days, "price above its moving averages" preceded -0.46% at 21 days (t=-4.40) while downtrend preceded +1.14% (t=+6.02). Use it to describe a trend and to manage a stop — not to decide direction.