Parabolic SAR
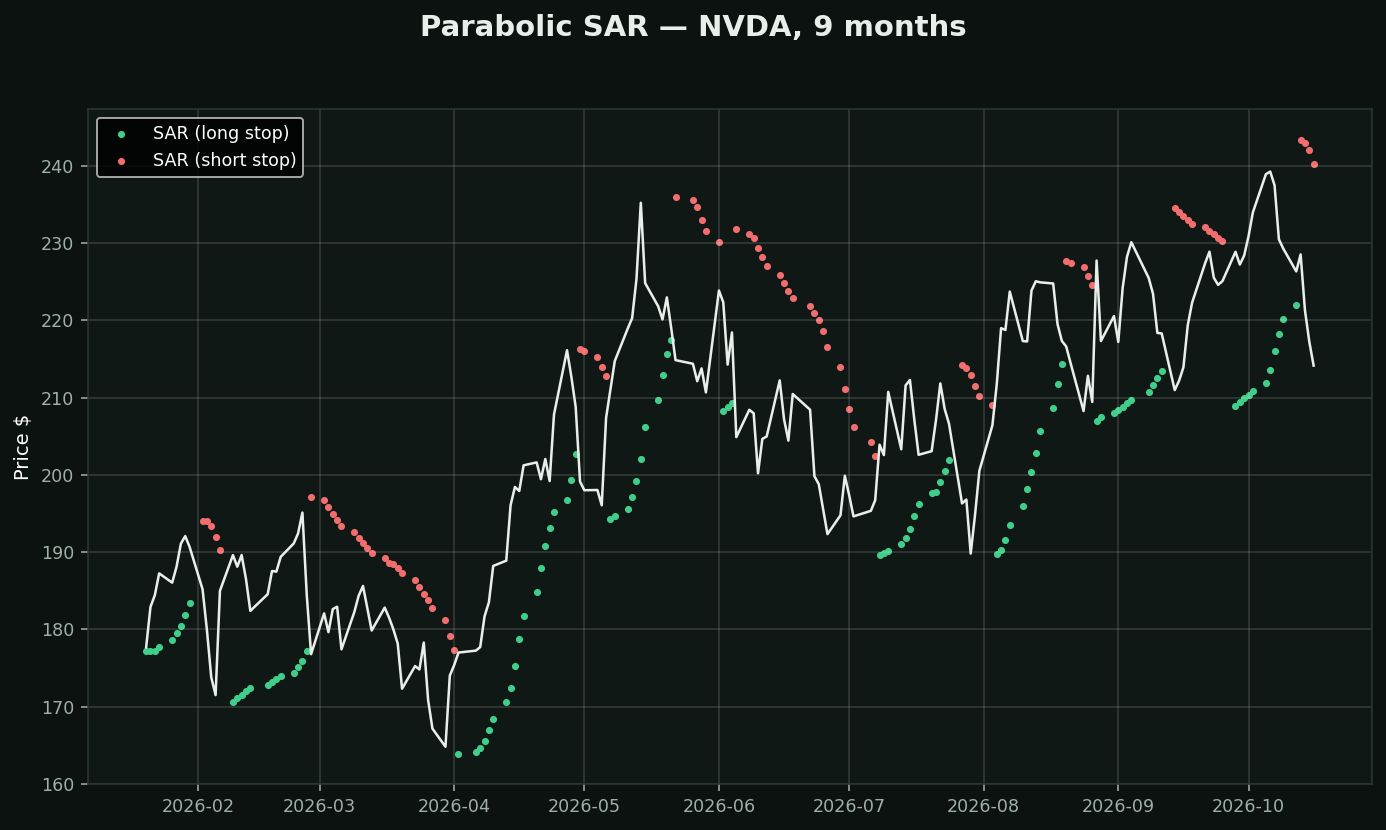
What it is: SAR stands for *stop and reverse*. A dot trails the price on one side; when price touches it, the dot jumps to the other side and the system flips. Wilder built it as a pure exit mechanism, never as an entry.
The clever bit — acceleration: the dot does not trail at a fixed distance. Every time the trend makes a new extreme, the step size increases (0.02, then 0.04, up to 0.20). A trend that keeps running gets its stop pulled in faster and faster. It is designed to give back less of a big winner.
How traders use it: as a trailing stop, which is the only thing it is good at. Enter on your own signal, then let SAR decide when the move is over.
What the chart shows: 18 flips in nine months. Every flip in a sideways stretch is a real loss. That is the well-known failure mode — SAR needs a trend to be worth anything, so pair it with Choppiness Index and switch it off above 61.8.
What testing here found: this is a trend-following tool, and that family did not survive its own test. Over 413,946 stock-days, "price above its moving averages" preceded -0.46% at 21 days (t=-4.40) while downtrend preceded +1.14% (t=+6.02). Use it to describe a trend and to manage a stop — not to decide direction.