Disparity Index
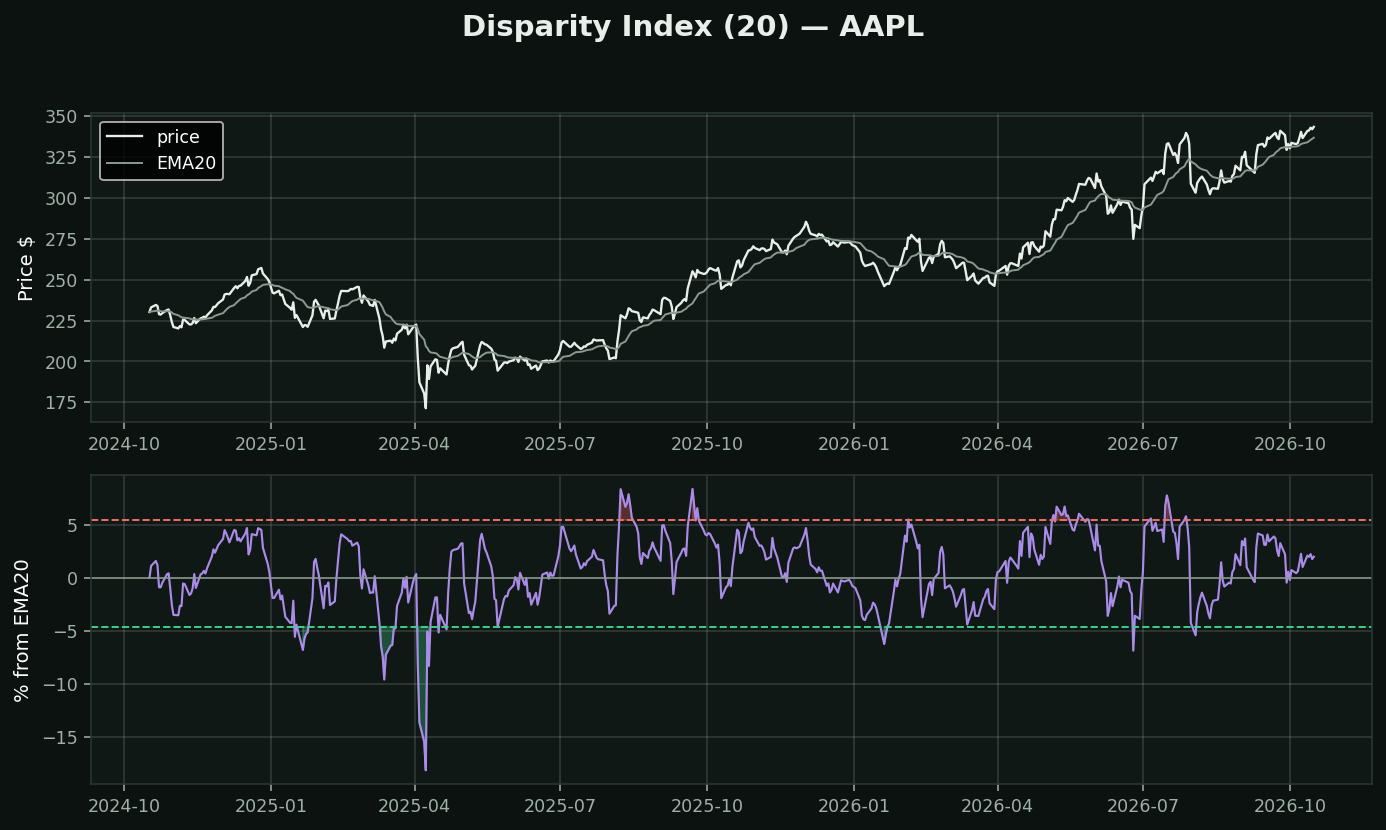
What it is: how far price is from its own moving average, as a percent. Originating in Japanese technical analysis, where it is called *kairi*.
Why it deserves more attention than it gets: almost every chart has a moving average on it, and almost nobody quantifies the distance to it. "Extended from the 20-day" is something people say. This is that sentence with a number attached, and the number can be screened, alerted, and tested.
The one thing you must do with it: set the thresholds PER STOCK. A utility 6% above its 20-day is at a historic extreme; a biotech 6% above is Tuesday. The dashed lines on this chart are this stock's own 5th and 95th percentiles over two years, not fixed levels out of a book. Any lesson quoting universal levels for this is wrong.
How traders use it: as a mean-reversion trigger — price stretched to its own 95th percentile above a 20-day average tends to come back to it.
What testing here found: this is the EXACT measure that inverted the toolkit's scanners. "Price above its moving averages" was read as bullish; measured over 413,946 stock-days it preceded -0.46% at 21 days (t=-4.40). Disparity is not a trend confirmation. It is a stretch reading, and stretch reverts.