Ease of Movement
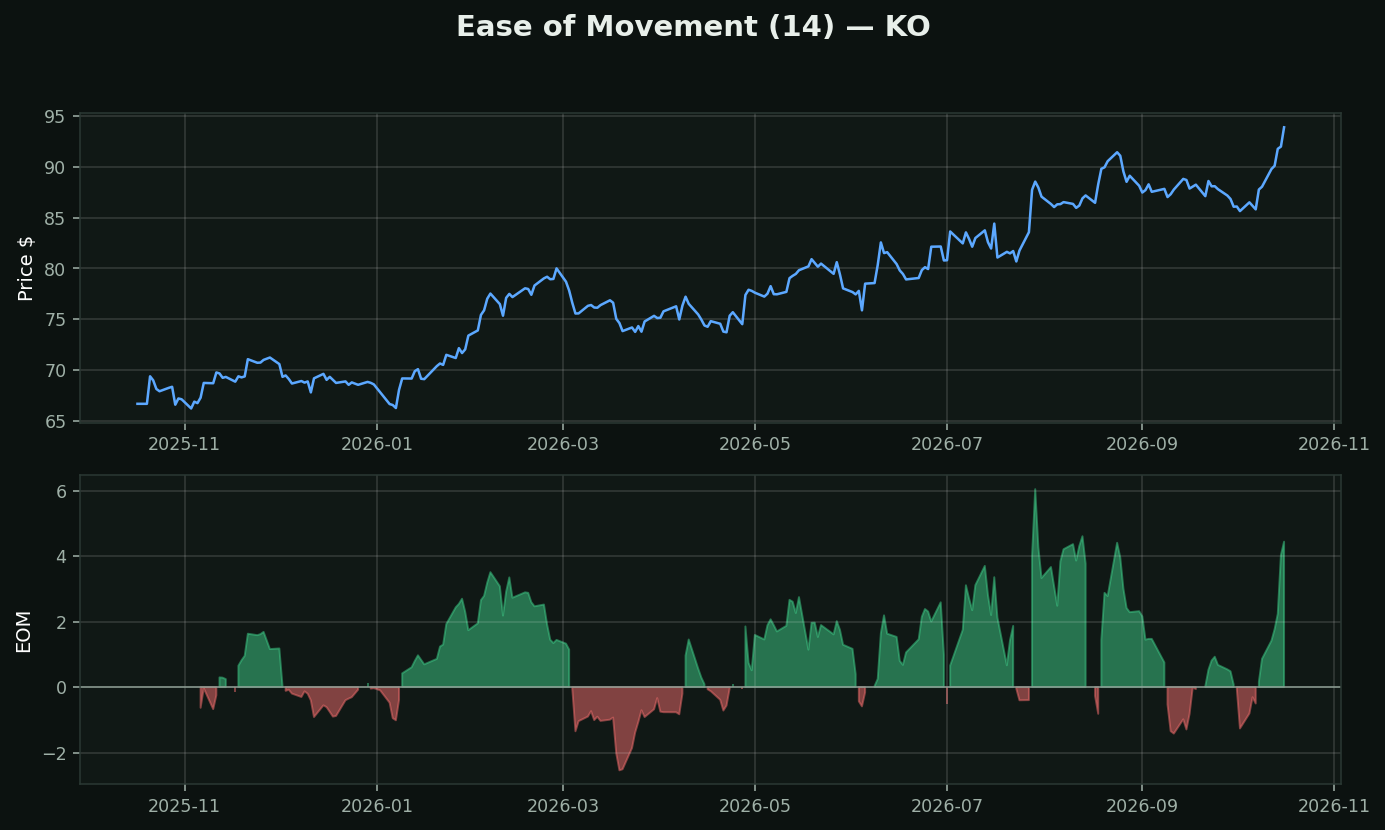
What it is: how far price moved, divided by how much volume it took to move it. Richard Arms — the same person behind the Arms Index and equivolume charts. High positive values mean price rose a long way on light volume.
The question nothing else asks: *was that move EASY?* Every other indicator measures the size of a move. This one measures its cost. A 3% gain on 10 million shares and a 3% gain on 100 million are the same to RSI and opposite to this.
How to read that honestly — it cuts both ways:
• Rising easily = no resistance, nobody is selling into it. Can also mean nobody is there at all, and thin moves reverse
• Grinding up on heavy volume = every point is being fought for. Slow, but somebody large is accumulating
How traders use it: mostly as a divergence and context tool. Price making new highs while EOM falls means each new high is costing more volume than the last — the buyers are having to work harder.
A practical warning: the denominator is a volume-to-range ratio, so a narrow-range day makes the value explode. Always read the smoothed line, never the raw daily print.