Detrended Price Oscillator
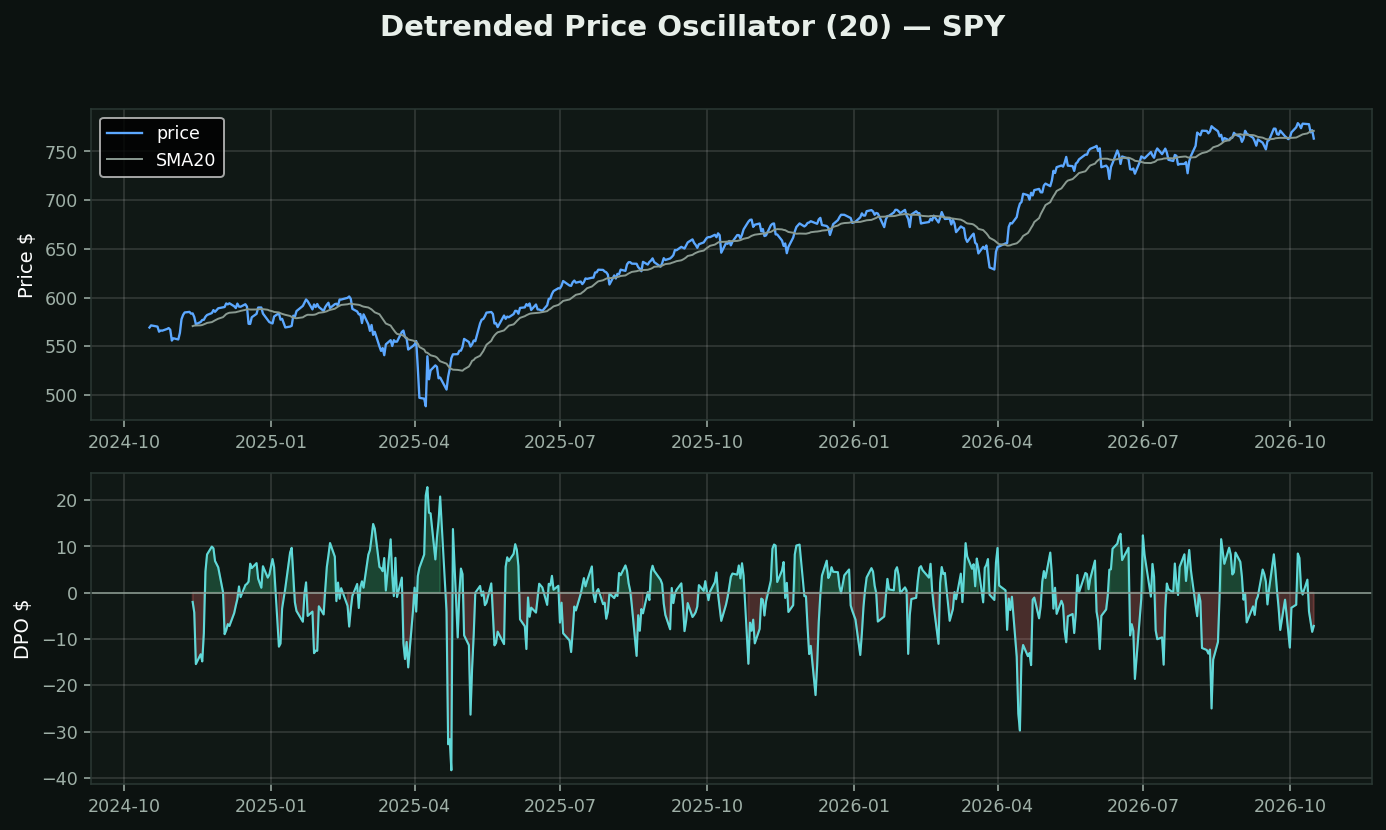
What it is: price minus its own moving average, with the price series shifted back by half the lookback plus one. The shift is the whole trick — it aligns the price with the CENTRE of the average window rather than the end.
What it is for: finding cycle length, and nothing else. By subtracting the trend it leaves only the oscillation around it, so peak-to-peak on the bottom panel is a measurement of how long this stock's short-term rhythm actually runs. That is a question no other indicator on the menu answers.
The thing almost everyone gets wrong: DPO is not a signal line. Because it is shifted backward in time, the most recent readings are incomplete and the line as drawn is partly hindsight. Trading a DPO crossover means trading a number that used data from after the bar it is plotted on.
How to use it properly:
• Measure the distance between peaks — that is your cycle length
• Feed that length back into your OTHER indicators' settings rather than accepting the defaults from a 1978 book
• Then take DPO off the chart
It is a calibration tool, not a trading tool.