ATR (Average True Range)
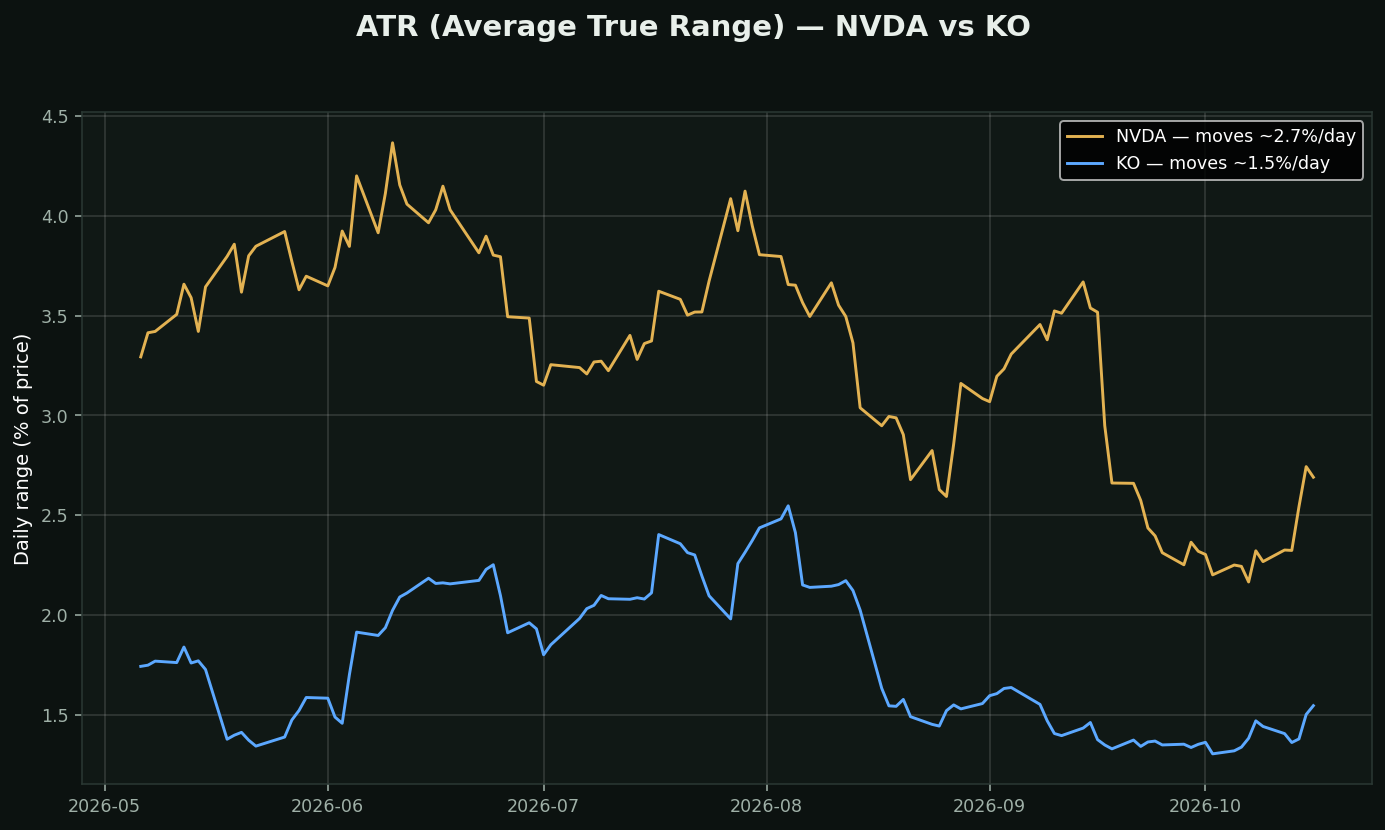
What it is: how much a stock *typically* moves in a day, in dollars or percent. Its personality. Not direction — just movement size.
Why it matters more than people think:
• Stops: a stop closer than ~1.5-2x ATR gets hit by pure noise — you were not wrong, your stop was just naive
• Position size: risk the same DOLLARS on every trade — fewer shares of wild stocks, more of calm ones
• Expectations: a 3% day in KO is an event; in NVDA it's Tuesday
Chart: NVDA vs KO daily range — same market, totally different animals.