Beta (market sensitivity)
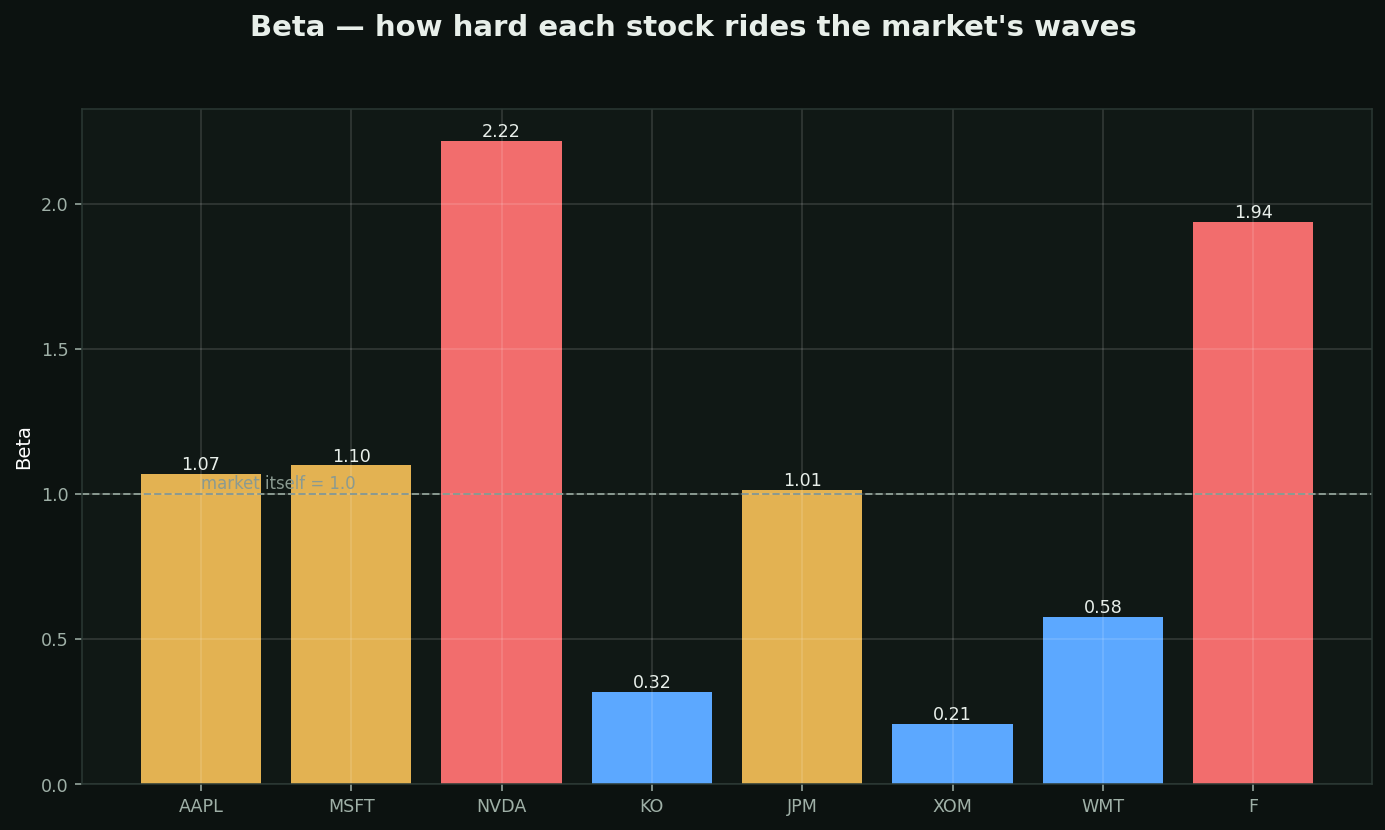
What it is: how much a stock moves when the MARKET moves 1%. Beta 2.0 = market drops 10%, expect ~-20%. Beta 0.5 = expect ~-5%.
How to read the chart: blue = defensive (<0.9), amber = market-like, red = aggressive (>1.3).
What beta really is: a POSITION SIZING instruction, not a quality score. The same $10k in a 2.5-beta chip stock is a 5x bigger market bet than in a 0.5-beta utility. Halve your size in high-beta names and your portfolio stops living and dying by tech tantrums.
The trap: beta is backward-looking and rises in crashes exactly when you wished it wouldn't. Treat it as a rough dial, not physics.