Support & resistance
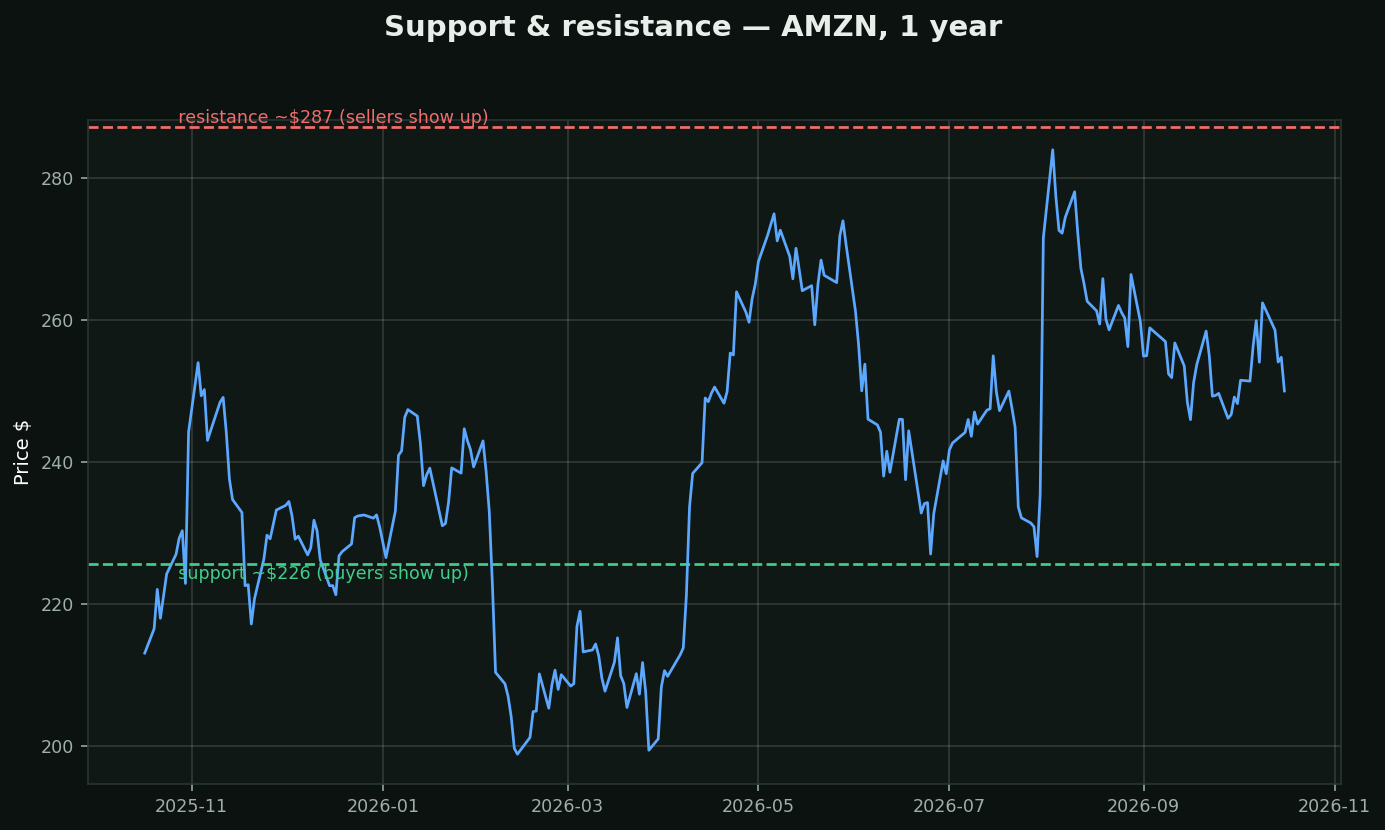
What they are: price levels where the stock has repeatedly reversed. Support = a floor where buyers keep stepping in. Resistance = a ceiling where sellers keep showing up.
Why they exist: memory. Everyone who bought at the old high and watched it drop is waiting to "get out even" — that's real sell pressure at that level.
How traders use them:
• Buy NEAR support with a stop just below it (small risk, defined exit)
• A clean BREAK above resistance often keeps running (old ceiling becomes the new floor)
• Never buy just under resistance — worst risk/reward spot on the chart
Chart: AMZN's key levels over the past year.