The 52-week range
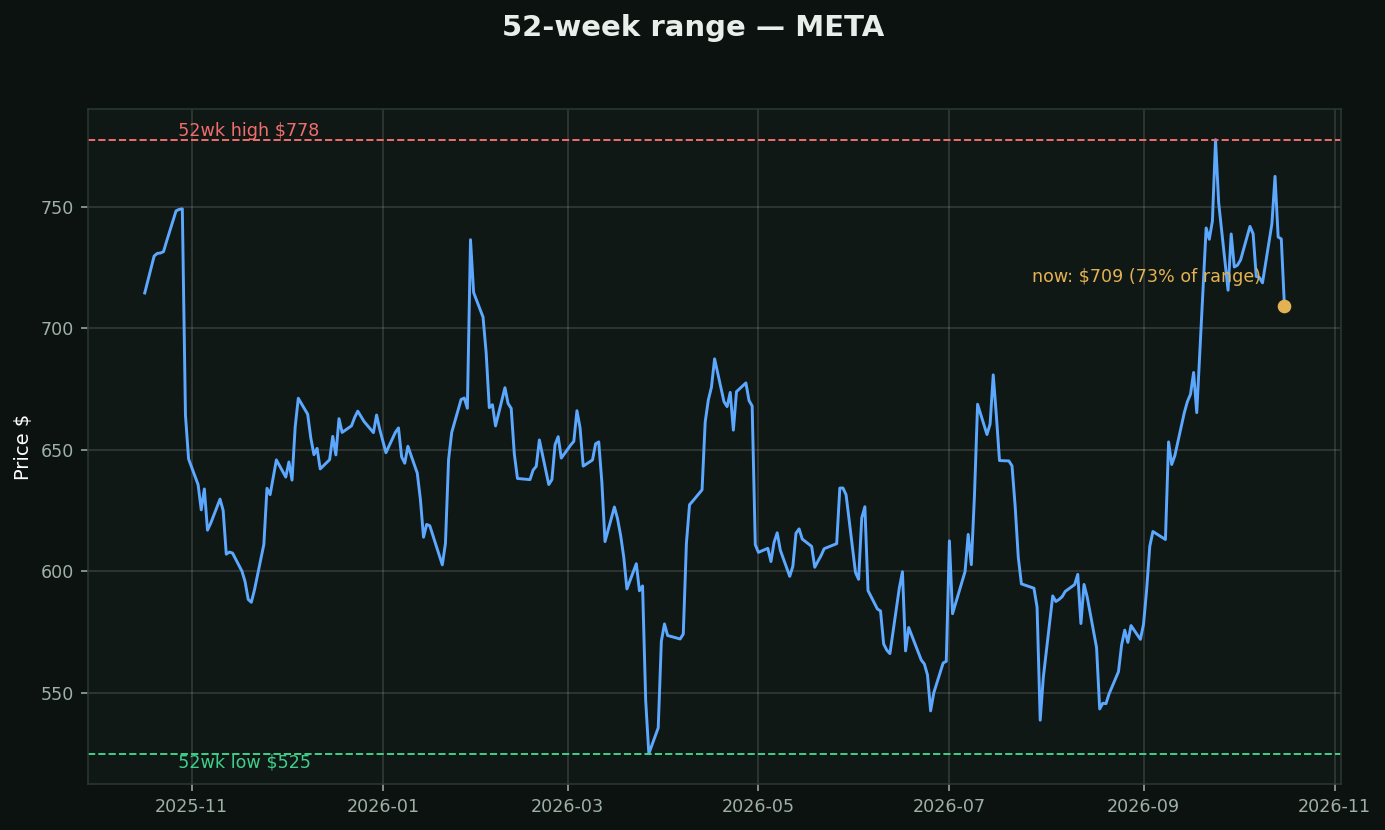
What it is: where price sits between its highest and lowest points of the past year — a one-number summary of the stock's current story.
The counterintuitive truth:
• Stocks at new 52-week HIGHS keep making highs more often than intuition says (momentum is real — winners win)
• Stocks at 52-week LOWS are only bargains when the *business* is fine and only the *price* fell — otherwise cheap gets cheaper
How traders use it: momentum traders buy strength near highs; value hunters shop near lows *with a fundamental checklist in hand*. Know which game you're playing — mixing them is how accounts bleed.
Chart: META's year — currently at 73% of its range.