Relative strength (vs the market)
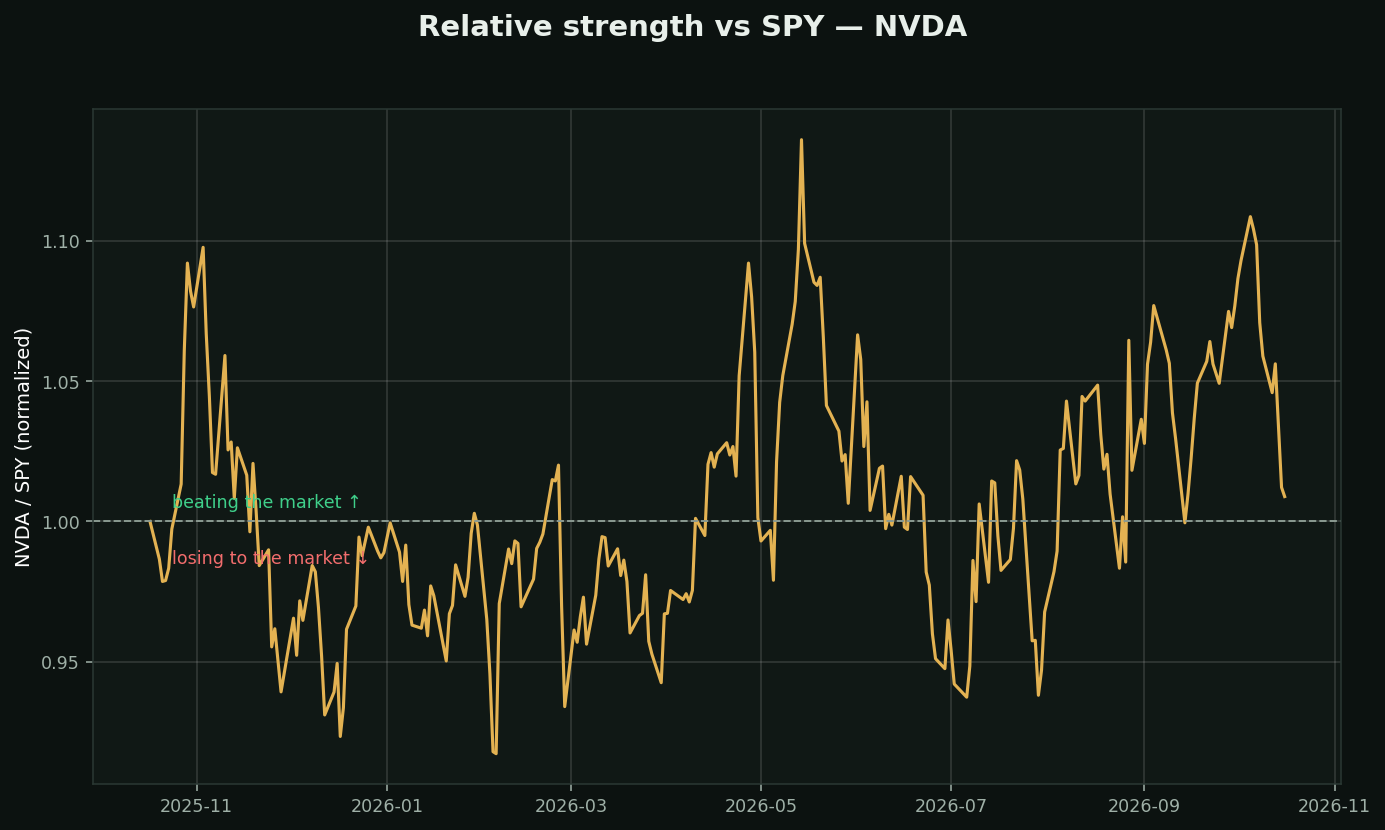
What it is: the stock's performance DIVIDED by the market's. Rising line = beating SPY, falling = losing to it — regardless of whether both are going up.
Why it beats looking at price alone: any stock looks good in a bull market. The question that predicts future winners is *is it stronger than everything else?* Leaders lead BEFORE their news explains why.
How traders use it:
• Market dips but your stock's RS line keeps rising = institutions holding & adding — the ones that rip when the market turns
• New price high WITHOUT a new RS high = leadership quietly fading
• The core of every momentum strategy that actually survives backtesting