Quality of earnings
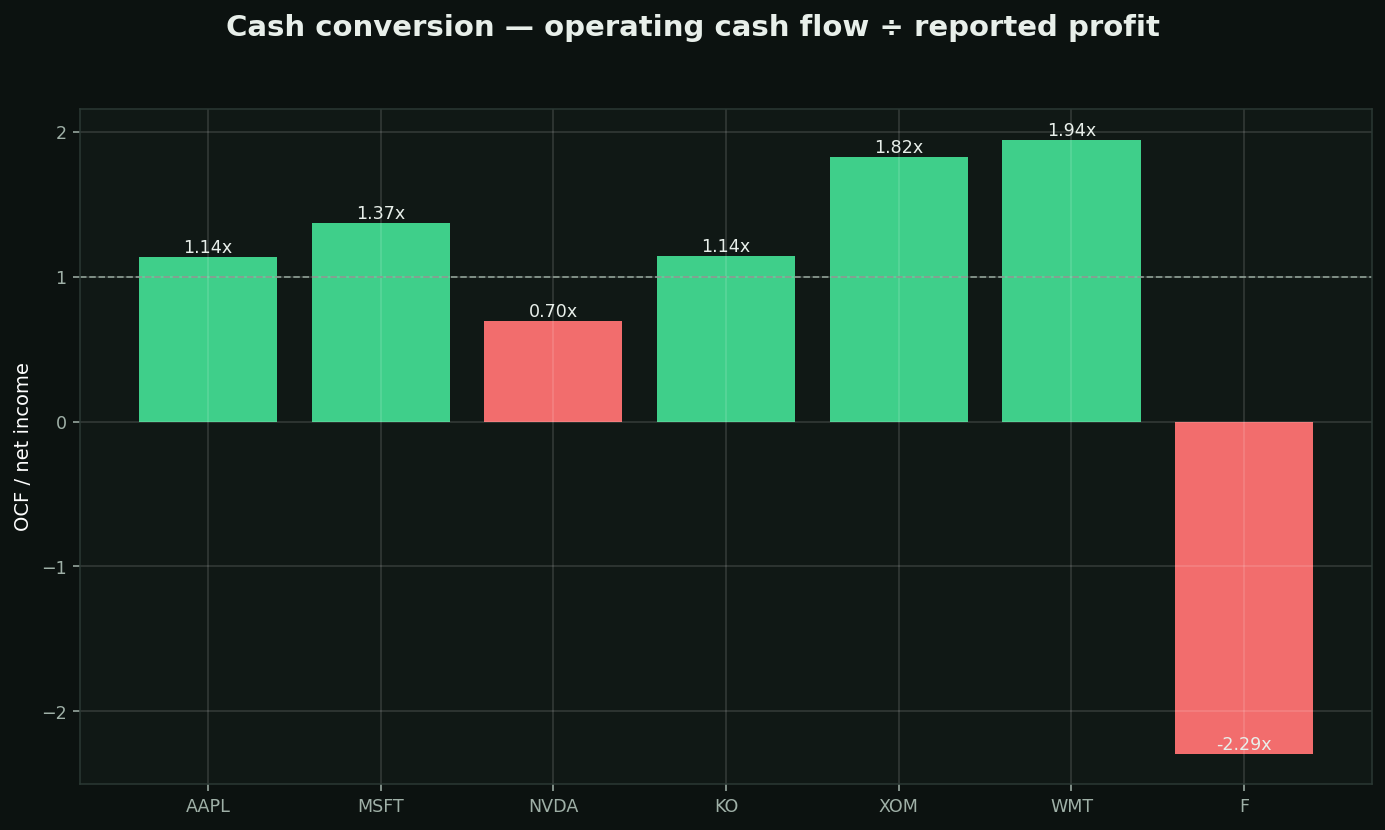
What it is: reported profit is an OPINION (full of estimates and assumptions); cash flow is a FACT. This ratio asks: for every dollar of claimed profit, how much actual cash arrived?
How to read it:
• 1.0x or higher (green) = clean earnings — profits are backed by cash
• Well below 1.0x, persistently (red) = profits exist on paper only — aggressive accounting until proven otherwise
The pattern that catches frauds: rising reported profits + falling cash conversion, quarter after quarter. Enron, Wirecard, Luckin — the income statement lied; the cash flow statement couldn't. Thirty seconds of checking this has saved careers.