OBV (on-balance volume)
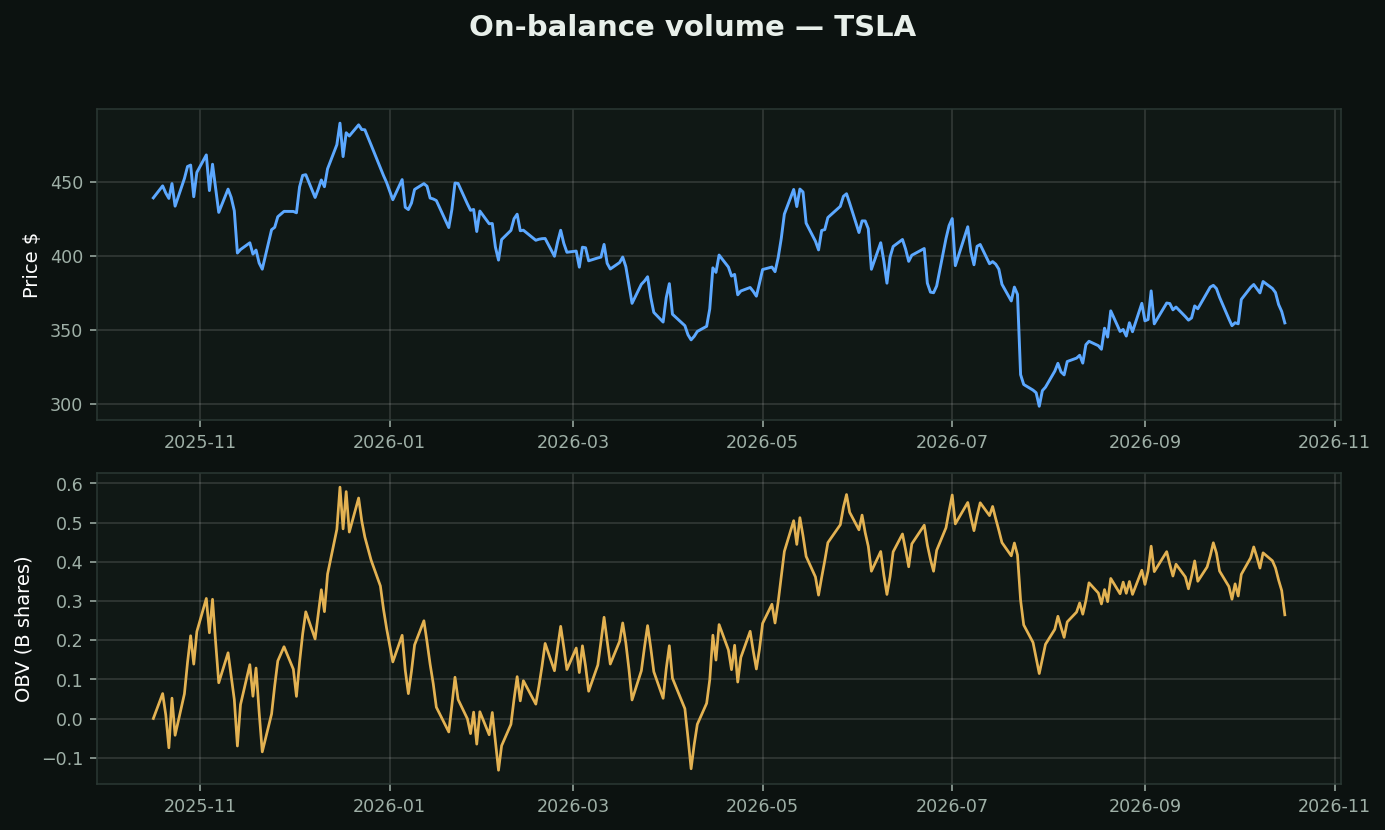
What it is: a running tally — add the day's volume when price closes up, subtract when it closes down. It tracks the cumulative FLOW of money.
The one thing to watch — confirmation vs divergence:
• Price rising AND OBV rising = healthy, real buying behind the move
• Price rising but OBV flat/falling = the rally has no volume behind it — distribution: smart money selling into strength
• Price flat but OBV climbing = quiet accumulation before a move
How traders use it: as a leading witness. Volume flows change direction before price does often enough to make OBV worth a glance on every chart you're about to buy.