Moving averages (50 & 200 day)
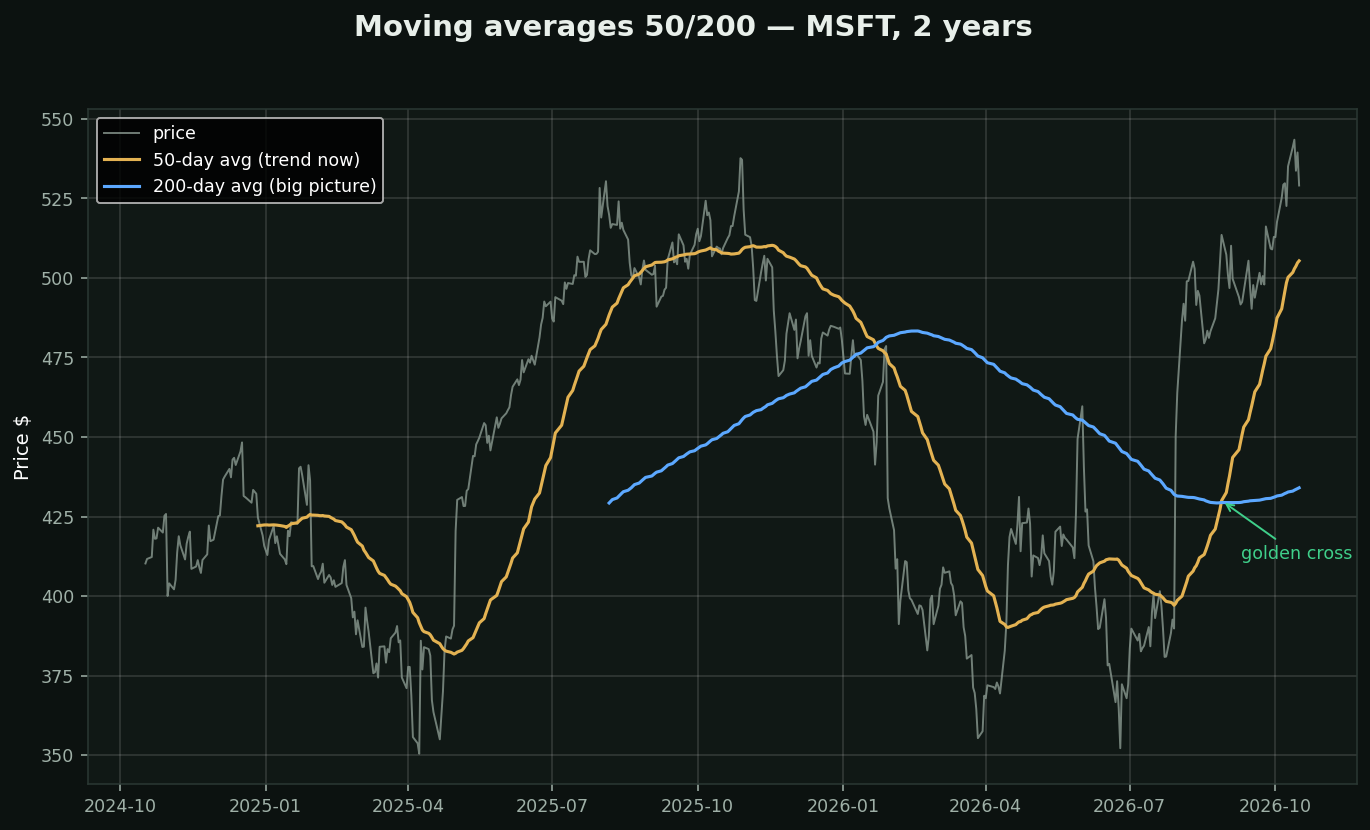
What they are: the average price over the last 50 or 200 days — smoothed lines that show the *trend* without the daily noise.
How to read them:
• Price ABOVE both = uptrend (own it) · below both = downtrend (avoid/short)
• Golden cross — 50-day crosses above 200-day = major trend turning up
• Death cross — 50 under 200 = trend turning down
• The lines also act as support: strong stocks bounce off their 50-day repeatedly
How traders use them: the simplest honest filter that exists. "Only buy above the 200-day" alone would have kept you out of most crashes in history.
Chart: MSFT over 2 years with both averages.
What testing here found: as a DIRECTION signal this inverted. Price above its moving averages preceded -0.46% over 21 days (t=-4.40, 413,946 stock-days). Moving averages describe where price has been; that is not the same as where it goes.