Ichimoku Cloud
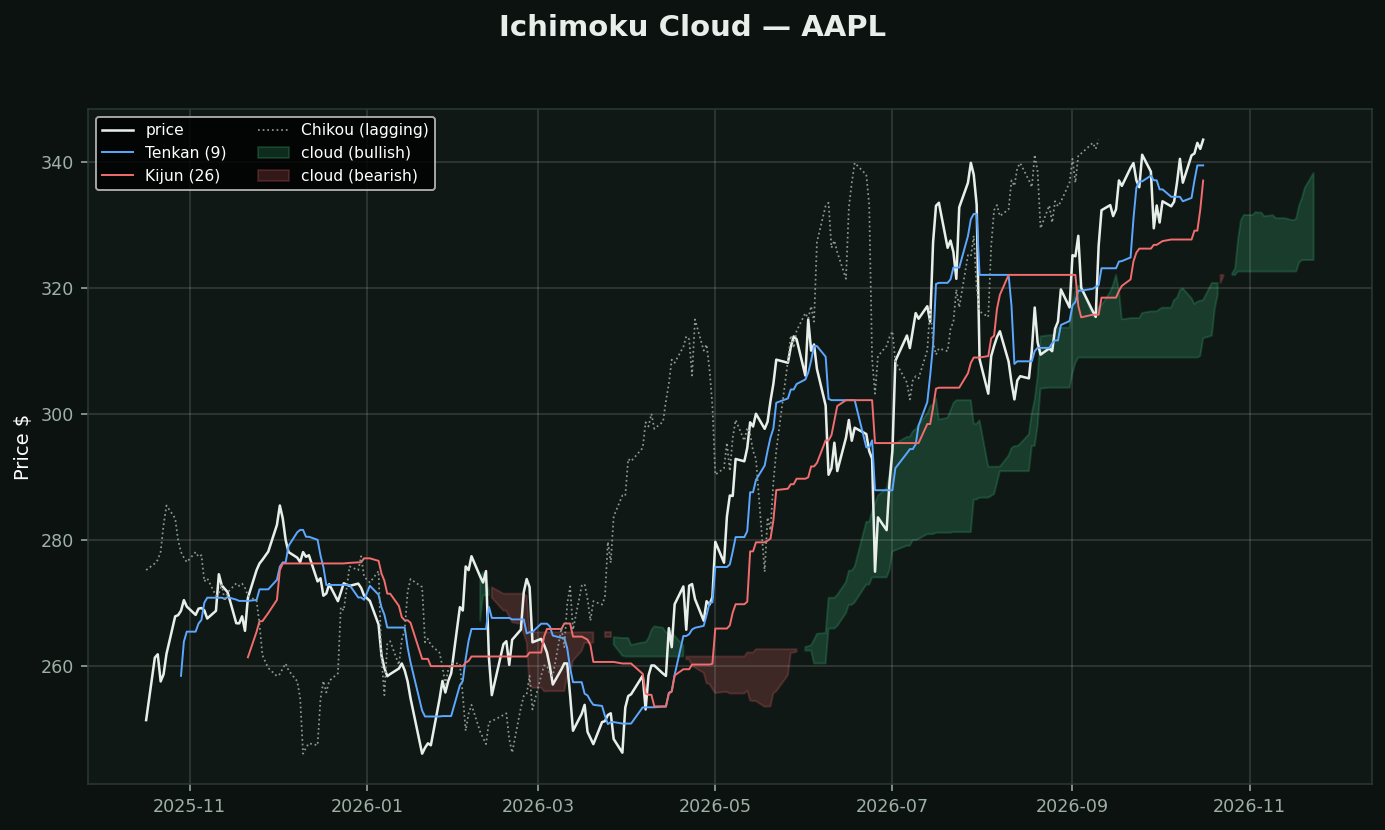
What it is: five lines that together try to replace a whole indicator panel. Developed by a Japanese journalist over 30 years and published in 1969. The name means *one-glance equilibrium chart*.
The five pieces:
• Tenkan (9) — fast midpoint of the 9-day range
• Kijun (26) — slow midpoint; the main trend line and a realistic stop
• Cloud — Tenkan/Kijun midpoint and the 52-day midpoint, both pushed 26 days into the future. This is the unusual part: the cloud shows you support and resistance before price gets there
• Chikou — today's close plotted 26 days in the PAST, to check the move against where the stock was trading then
How traders read it: price above a green cloud is the textbook uptrend; a thick cloud is strong support, a thin one is easily cut through.
Honestly: note the midpoints — this is five moving averages wearing a costume. Its real edge is the forward projection and the cloud's thickness, not the crossovers.
What testing here found: this is a trend-following tool, and that family did not survive its own test. Over 413,946 stock-days, "price above its moving averages" preceded -0.46% at 21 days (t=-4.40) while downtrend preceded +1.14% (t=+6.02). Use it to describe a trend and to manage a stop — not to decide direction.