Historical Volatility
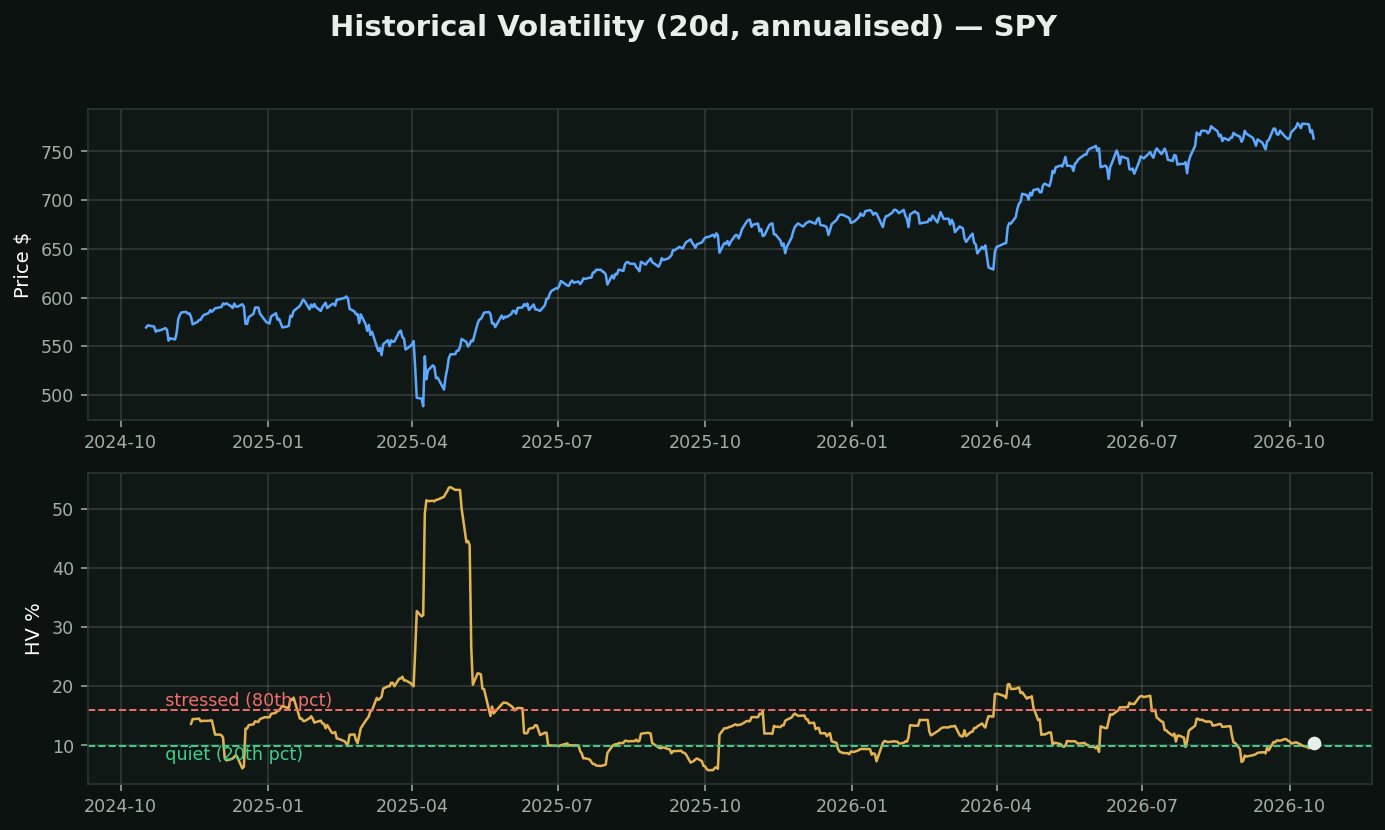
What it is: the standard deviation of daily returns, annualised. HV 20% means that if the last month repeated forever, a one-standard-deviation year is ±20%. It is backward-looking and it is a FACT, not an opinion.
Why it is the most important number on this list: implied volatility is what options are priced at; historical volatility is what the stock actually did. The gap between them is the variance risk premium, and in this toolkit the option-pricing signals are the family that survived audit while the chart-pattern signals did not. IV Rank — the leg that drives the options scanner here — is literally current IV measured against this HV range.
How traders use it:
• IV well above HV → options are expensive → sell premium
• IV below HV → options are cheap → buy them
• HV is mean-reverting: quiet follows loud and loud follows quiet, far more reliably than price does anything
Chart: SPY's HV is 10% — higher than 28% of the last two years.