VWAP (volume-weighted average price)
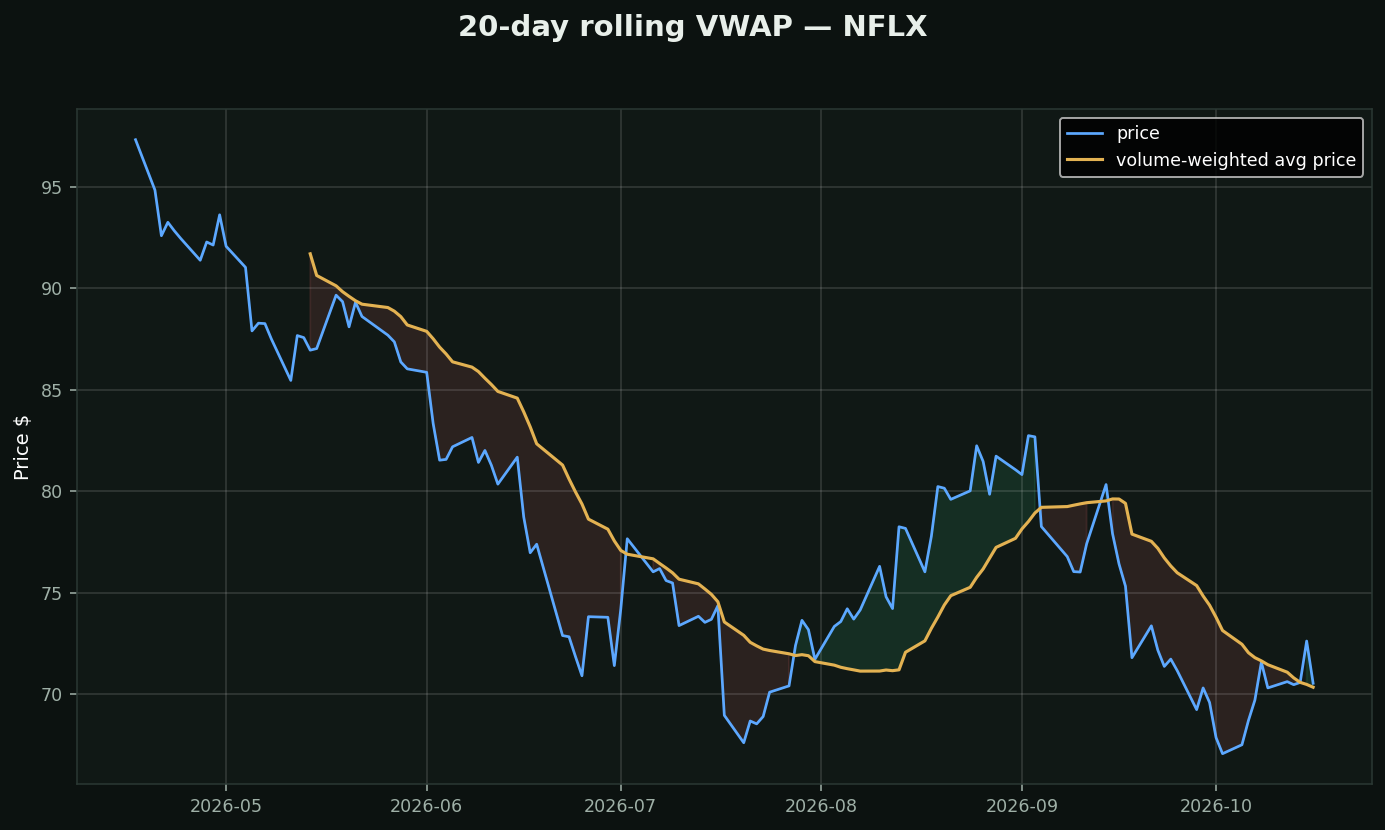
What it is: the average price where shares ACTUALLY changed hands — big-volume days count more. The market's real cost basis.
How to read it:
• Price above VWAP (green) = the average recent buyer is in profit → dips get bought
• Price below VWAP (red) = average buyer underwater → rallies get sold by people escaping at break-even
Why institutions care: fund managers are literally graded on beating VWAP on their fills. Their algos buy below it and wait above it — which is WHY it acts as support and resistance. You're seeing their homework.