Volume Profile
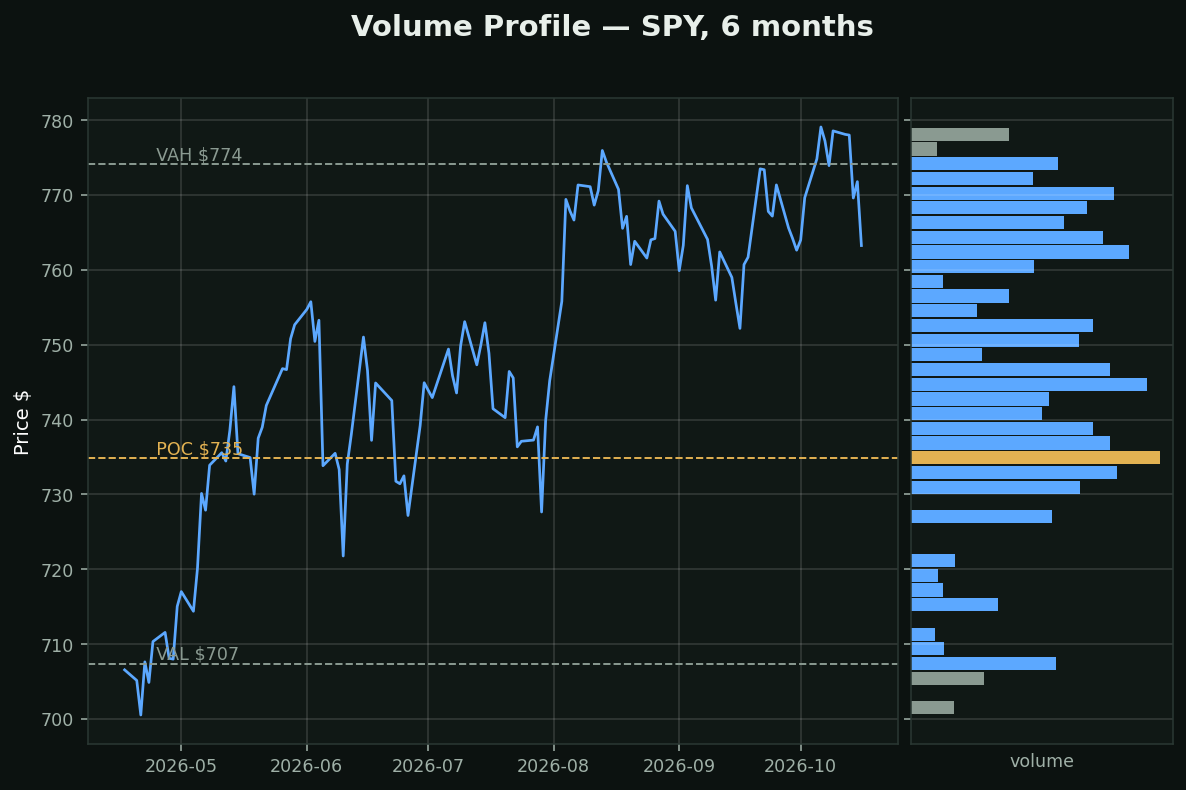
What it is: every other volume study plots volume against TIME. This one plots it against PRICE — how much stock actually changed hands at each level over the period.
The three lines:
• POC (point of control, $735) — the price with the most volume. The market's centre of gravity
• Value Area ($707–$774) — where 70% of the volume traded. The range the market agreed was fair
• Low-volume nodes — the thin bars. Price tends to move FAST through them because nobody has a position to defend there
Why it matters: support and resistance drawn by eye is a guess about where people care. Volume profile measures it. A level where 50 million shares traded is a real wall; a level where a trendline happens to land is not.
How traders use it: fade the edges of the value area back to the POC in a range; when price leaves the value area on volume, the next high-volume node above or below is the logical target.