Trade Volume Index
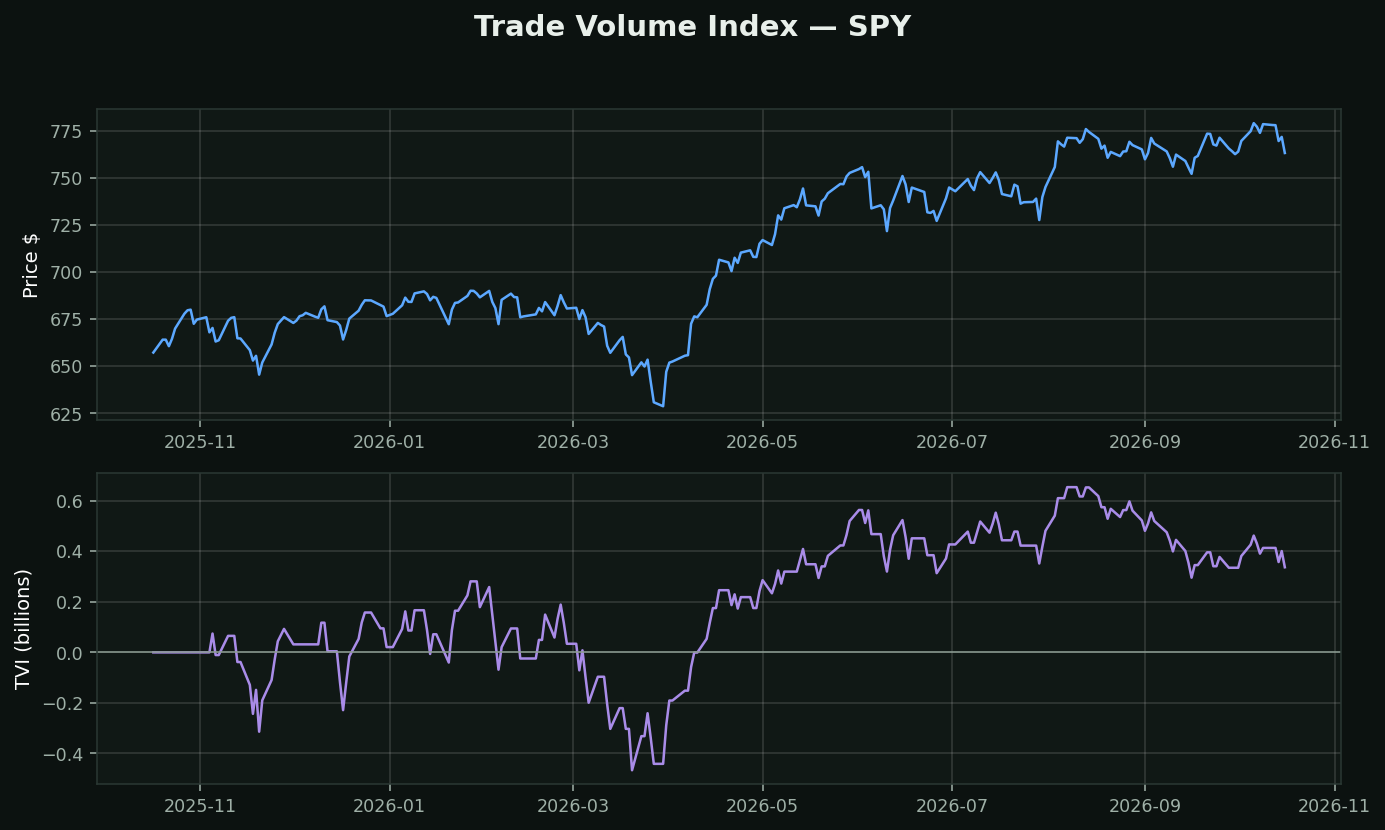
What it is: another running volume total, with one idea the others do not have — a dead zone. Price must move more than a set threshold before the day counts at all. Inside the threshold, volume is ignored entirely.
The problem it was built for: TVI comes from tick data, where most prints are the bid and ask flapping with no real trade behind them. Counting that as buying or selling is counting noise. The threshold (originally one tick, here a quarter of ATR) says: *if it did not move meaningfully, it did not mean anything.*
On this chart 34% of days fell inside the dead zone and contributed nothing. Every other study in this category counted all of them.
Why that is the interesting idea: it is the only volume study here that can say *no opinion*. OBV, A/D and PVT are forced to score every single day as accumulation or distribution, including the ones that were genuinely just drift.
The catch: on daily bars the original justification is mostly gone — daily closes are real prices, not bid/ask flicker. TVI on a daily chart is a good idea applied to the wrong timeframe. It belongs on intraday data, where it came from.