Accumulative Swing Index
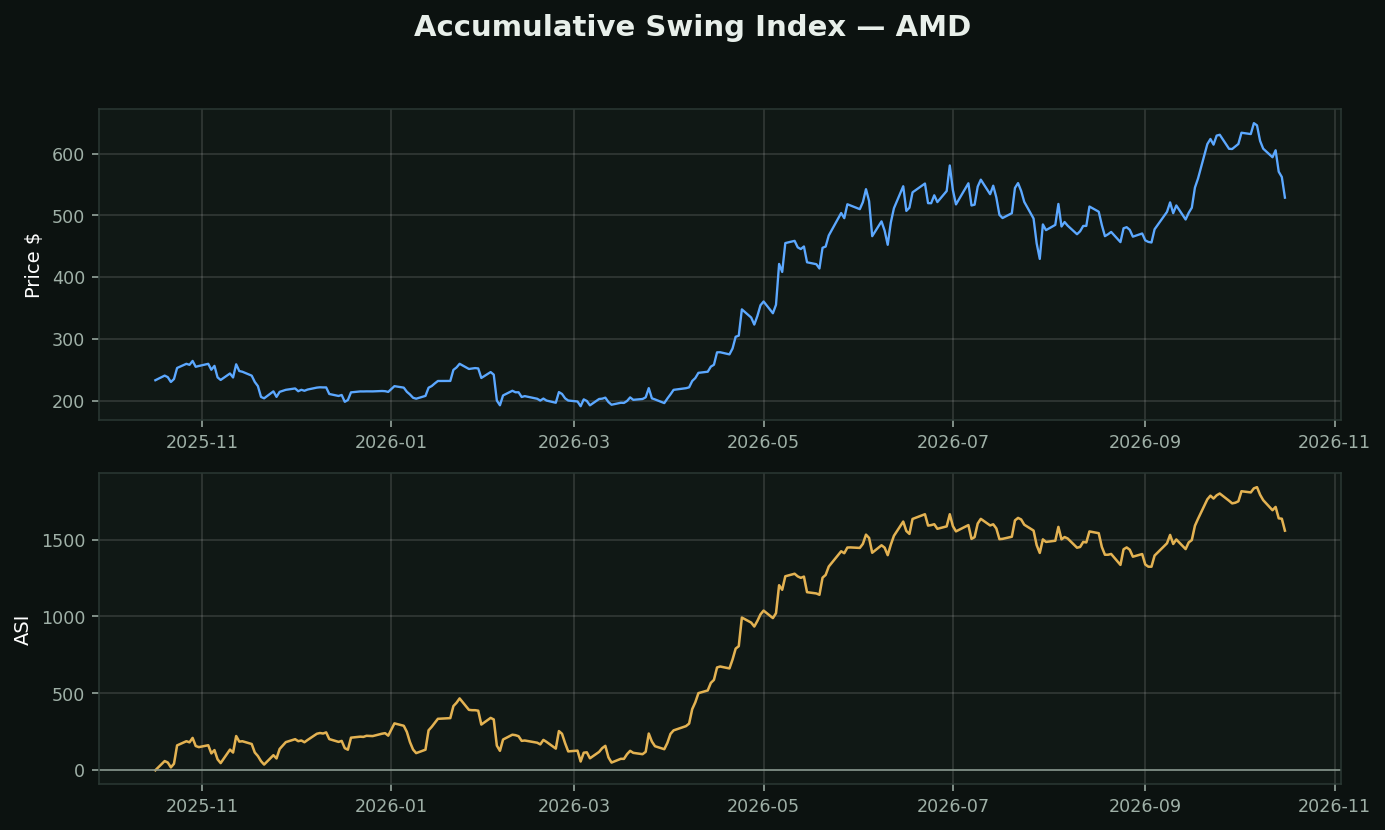
What it is: Welles Wilder's attempt to build a 'real' price line. The Swing Index scores each day using the open, high, low, close AND the previous day's open and close — then accumulates them.
The problem Wilder was solving: he worked in futures, where the contract you are looking at expires and rolls to the next one, leaving artificial jumps in the chart. He wanted a continuous line that reflected genuine price movement rather than contract mechanics.
Why it is the only study here that uses the OPEN this heavily: Wilder's argument was that the relationship between today's open and yesterday's close is where overnight information gets expressed, and a line built only from closes throws that away.
What it is actually used for now: trendline and breakout analysis on a smoother line than price. Wilder's own rule — a break of the previous ASI extreme confirms a price breakout — is a filter against false breaks.
The honest caveat: the formula has a limit-move term `T` designed for commodity contracts with daily price limits. Stocks have no such limit, so every stock implementation substitutes something, and different platforms substitute different things. Two charts of ASI on the same stock can legitimately disagree.
What testing here found: this is a trend-following tool, and that family did not survive its own test. Over 413,946 stock-days, "price above its moving averages" preceded -0.46% at 21 days (t=-4.40) while downtrend preceded +1.14% (t=+6.02). Use it to describe a trend and to manage a stop — not to decide direction.