Stochastic RSI
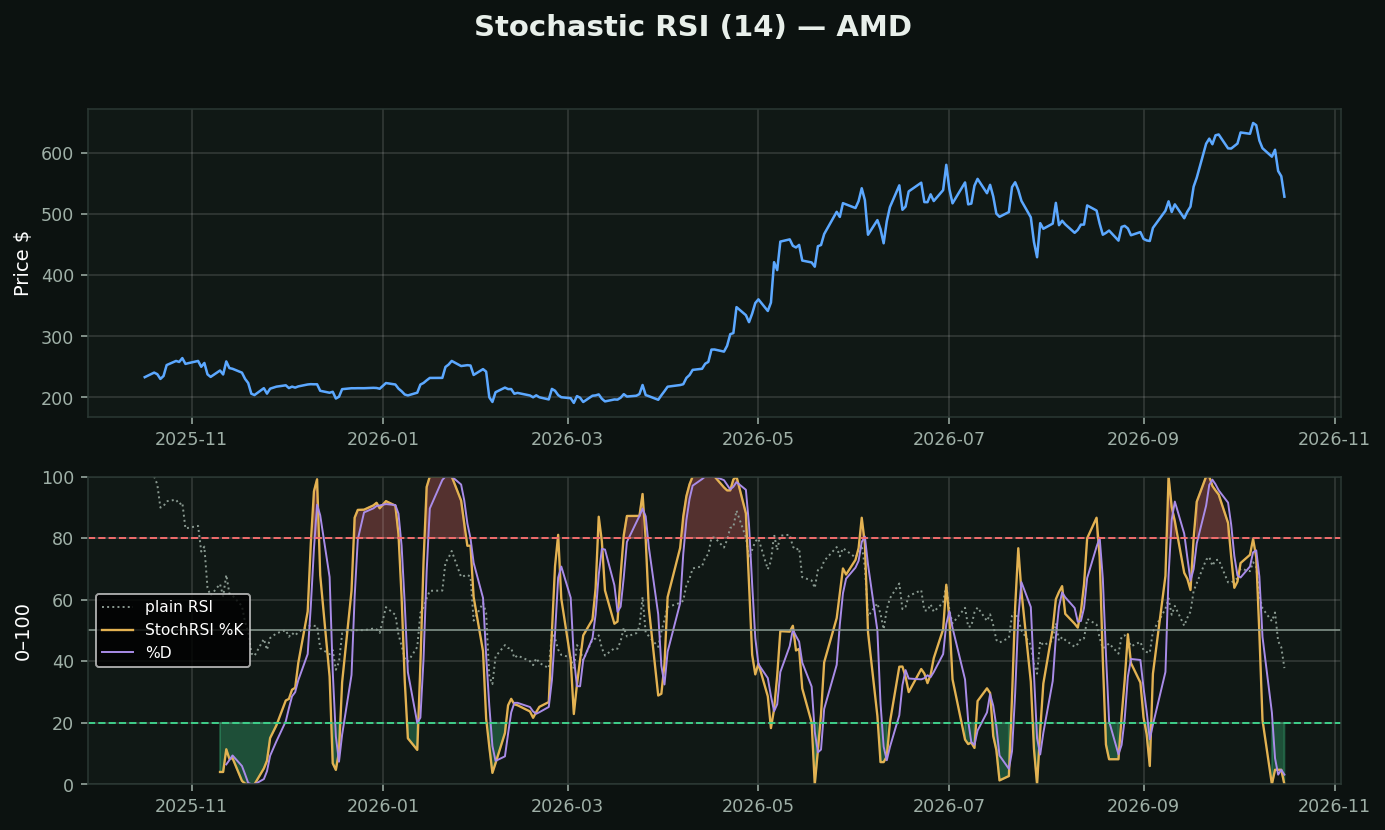
What it is: the Stochastic formula applied to RSI instead of to price. It asks *where does today's RSI sit inside its own 14-day range?* — an indicator of an indicator.
The problem it solves: in a strong stock RSI may spend months oscillating between 45 and 70, never touching 30 or 70's far side. Plain RSI says "nothing to see" for that entire stretch. StochRSI rescales to whatever range RSI has actually been using, so it still finds the local extremes.
The price you pay: it is far noisier. Rescaling a narrow range to 0–100 amplifies every wiggle, so StochRSI hits 0 and 100 constantly. The grey dotted line on the chart is plain RSI over the same window — note how much calmer it is.
How traders use it:
• As a timing refinement, never a standalone signal — take the direction from something slower and the entry day from this
• The %K/%D cross out of an extreme is the usual trigger
• Treat readings of exactly 0 or 100 as normal here, not as remarkable
What testing here found: the contrarian read on this family holds up. Across 413,946 stock-days, RSI-oversold names beat the base rate by +0.82% over the next 21 days (t=+4.09) and overbought names trailed by -0.58% (t=-4.27). Oscillators that measure stretch survived their test here; the trend-followers did not.