STARC Bands
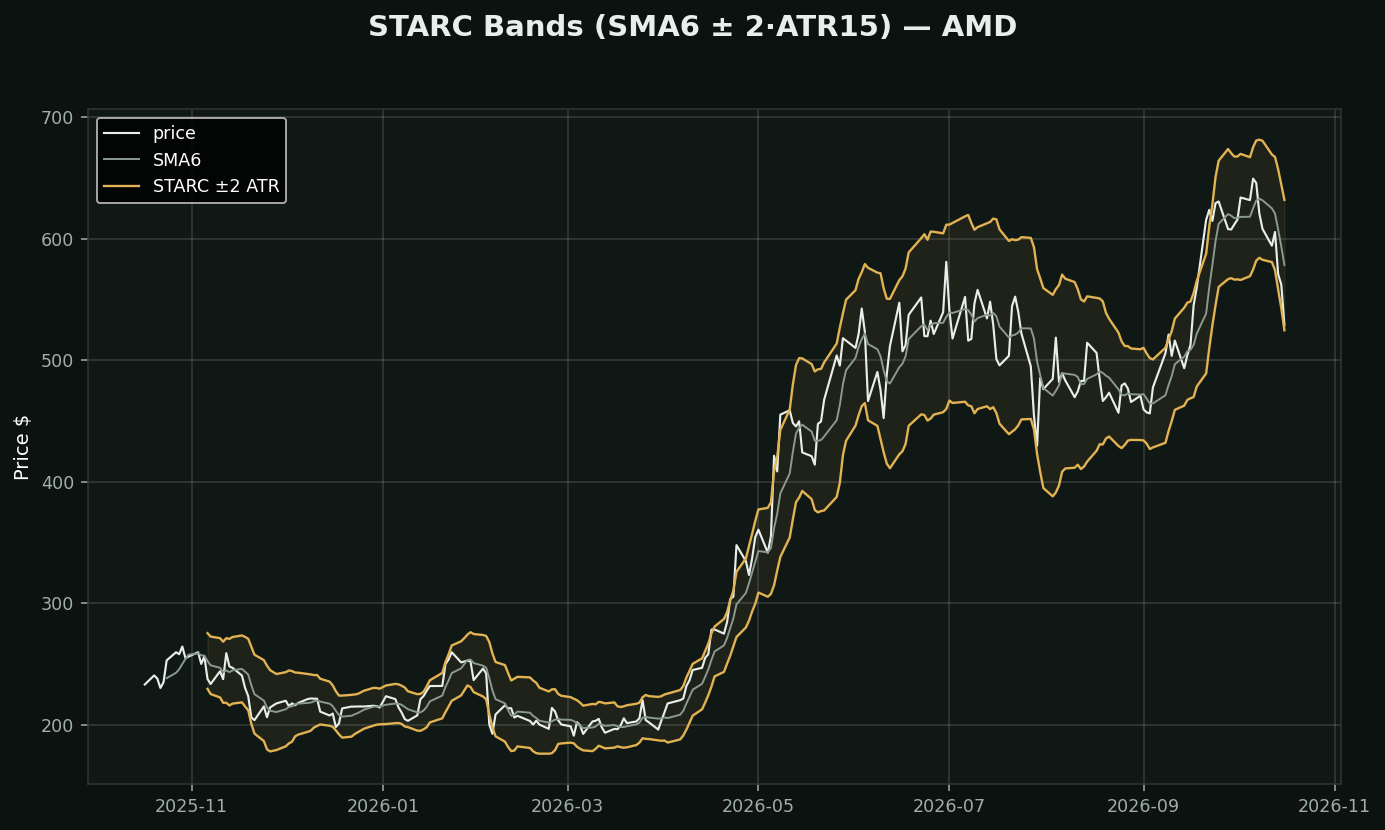
What it is: Stoller Average Range Channels. A short 6-period average with bands two ATRs out. Manning Stoller.
Yes, this is Keltner with different numbers. Keltner uses a 20-period EMA and roughly 2 ATRs; STARC uses a 6-period SMA and 2 ATRs. Same construction, faster centre line. Being honest about that is more useful than pretending otherwise.
What the fast centre line changes: STARC hugs price. The bands are not trying to contain a whole swing — they mark the realistic boundary of the next few days. Stoller's framing was explicitly about RISK, not signals:
> *Buying near the lower band is the lowest-risk long available; buying at the upper band is the highest-risk long, whatever the trend says.*
Why that framing is worth more than the indicator: it does not predict anything. It says where you are in the distribution of entries, which is a question you can answer honestly at any moment. Most of the study library is trying to tell you WHAT will happen; this one only tells you what you are risking to find out.
Practical use: with a directional view from elsewhere, wait for the favourable band rather than entering at the signal. Same trade, better price, smaller stop.