Speed resistance lines
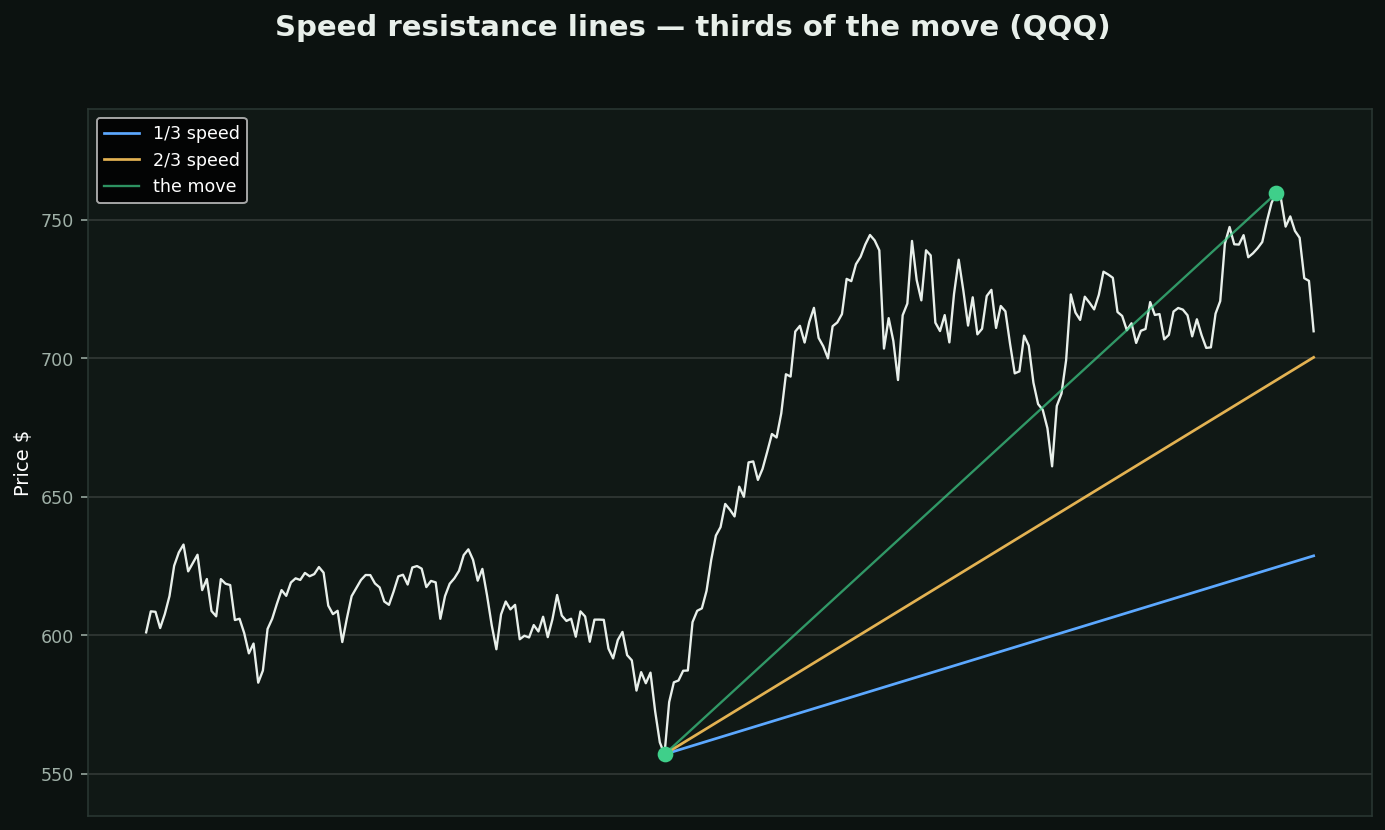
What they are: Edson Gould's simplification of Gann. Take a move from low to high, divide it into thirds, and draw rays from the start through the one-third and two-thirds points. Support falls over time at those two 'speeds'.
Why they are better built than a Gann fan: the anchors are defined by the move itself — the actual low and the actual high — rather than by an angle you choose. Change the chart scale and the lines still pass through the same PRICES on the same dates. Gann's 1×1 cannot say that.
What they are actually saying: a pullback that holds above the two-thirds line is losing ground slowly; one that breaks the one-third line has given back most of the move. That is a way of grading the SPEED of a retreat, not just its depth — and depth is all a Fibonacci retracement measures.
That difference is the reason to learn this one. Two pullbacks can reach the same price, one over four days and one over four months, and they are not the same event. A horizontal level cannot tell them apart. A sloping one can.
The limit: you still choose which move to anchor to.
The deeper problem: you choose the two anchor points. Move them one bar and every level moves with them. A tool whose output depends on a choice you make cannot be backtested, because there is no rule to test — and a method that cannot be shown wrong cannot be evidence.