ROIC (return on invested capital)
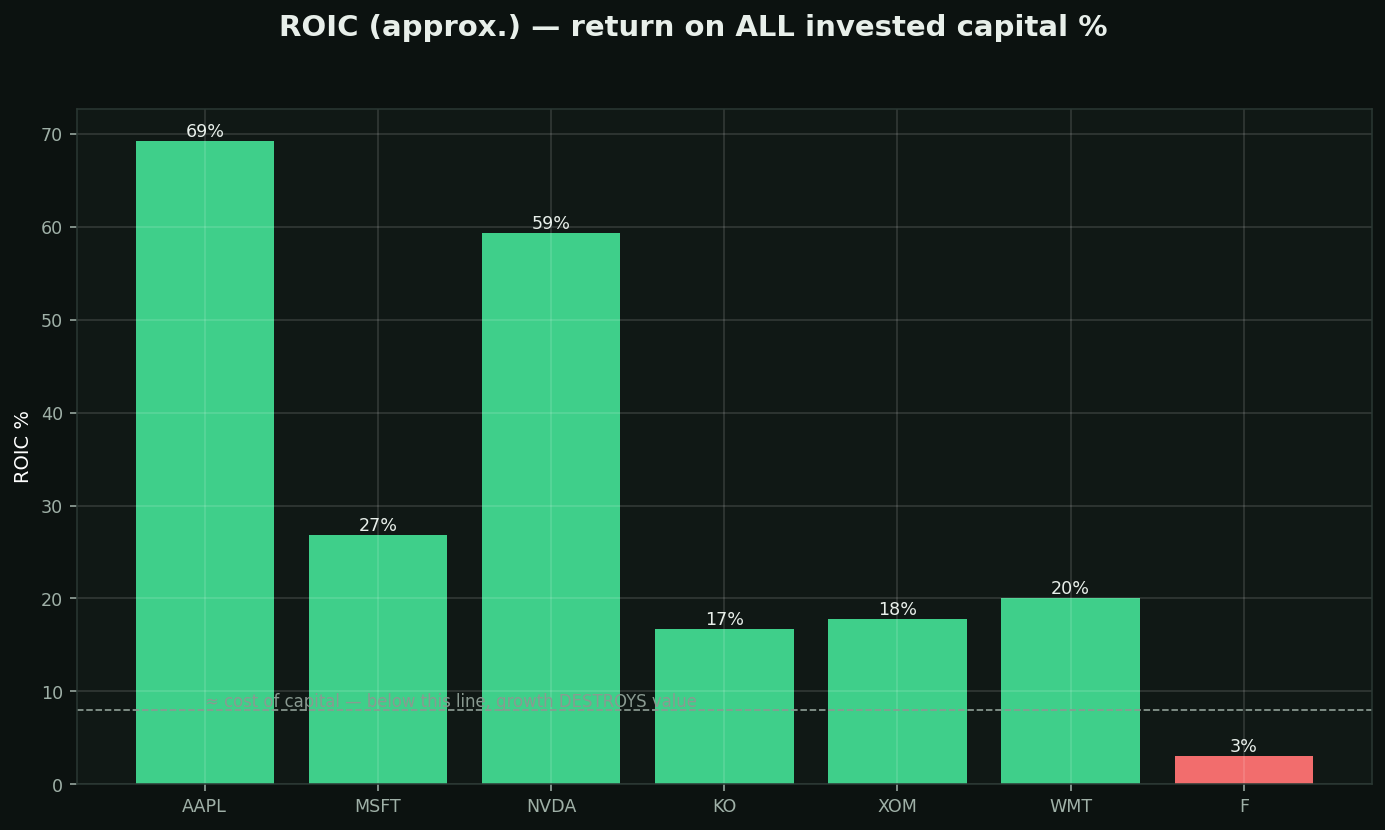
What it is: profit generated per dollar of ALL capital in the business — shareholders' AND lenders'. ROE's honest sibling: debt can't inflate it.
The one comparison that matters: ROIC vs the cost of capital (~8%).
• Above it = every dollar reinvested creates value — growth is good
• Below it = the business destroys value AS IT GROWS — expansion makes things worse
Why quality investors treat this as the master metric: long-run stock returns converge toward ROIC. A 20%-ROIC business held for a decade bails you out of a mediocre entry price; a 4%-ROIC business punishes even a great one. (Chart uses a simplified estimate from public data.)