Rate of Change and Momentum
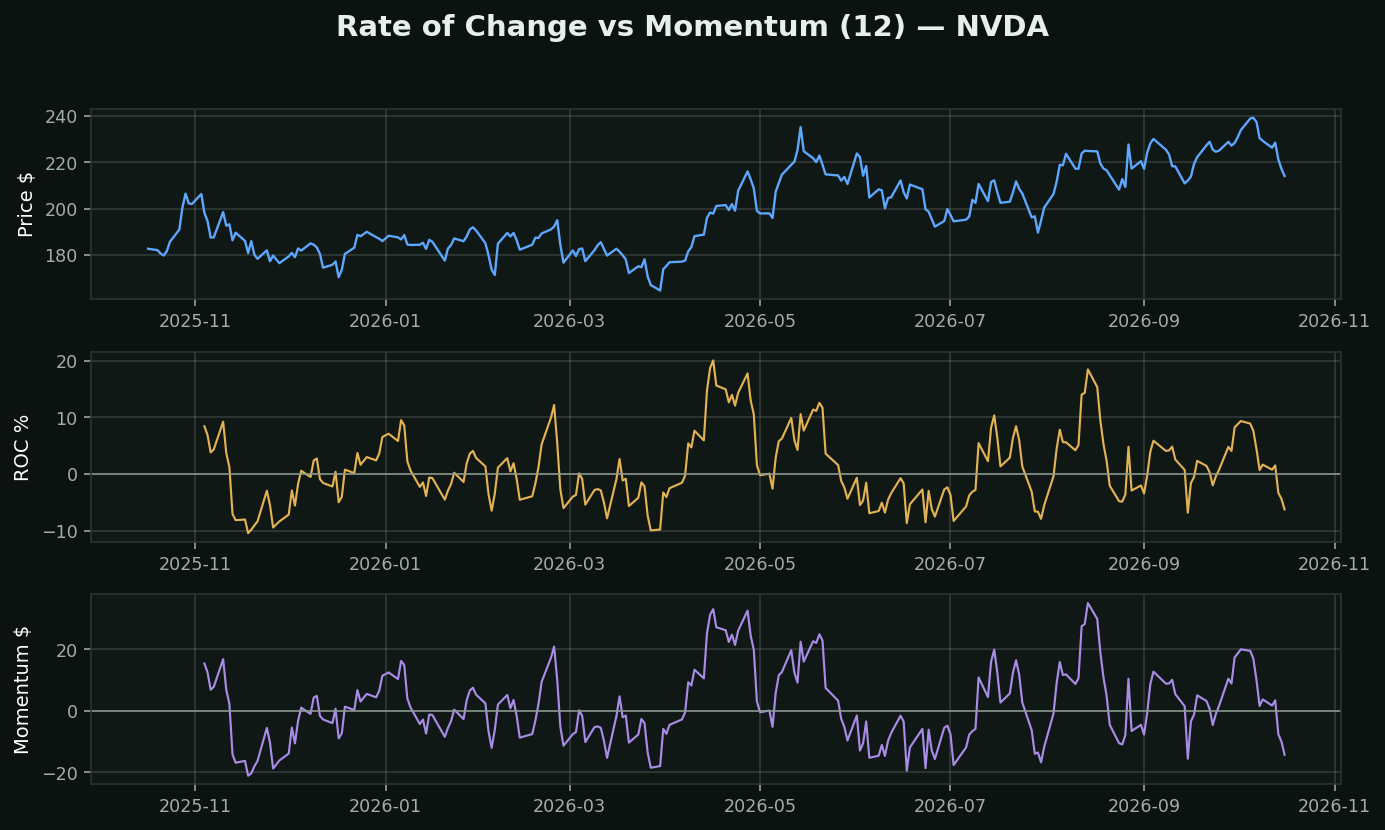
What they are: the two simplest indicators that exist, and the ancestors of most of this category.
• Momentum = today's close − the close 12 days ago. In dollars
• Rate of Change = the same thing as a percentage
Why the difference matters more than it sounds: Momentum in dollars is not comparable between stocks or across time. A $10 move is enormous in a $30 stock and a rounding error in a $900 one — and the same stock at $30 five years ago is not the same stock at $300 today. The middle and bottom panels are the same data; only the bottom one can be compared to anything.
This is the whole reason for the rest of the shelf. RSI, CMO, TSI and Stochastic are all attempts to normalise this one measurement so it means something consistent. Learn what they are normalising and the category stops looking like twenty inventions.
What testing here found: measured directly over 413,946 stock-days, 3-month momentum was one of the clearest failures in the toolkit — momentum-UP preceded -0.18% (t=-1.72, no signal) while momentum-DOWN preceded +1.26% (t=+7.08). Buying what has been going up is the version of this that does not work.