Relative Volatility Index
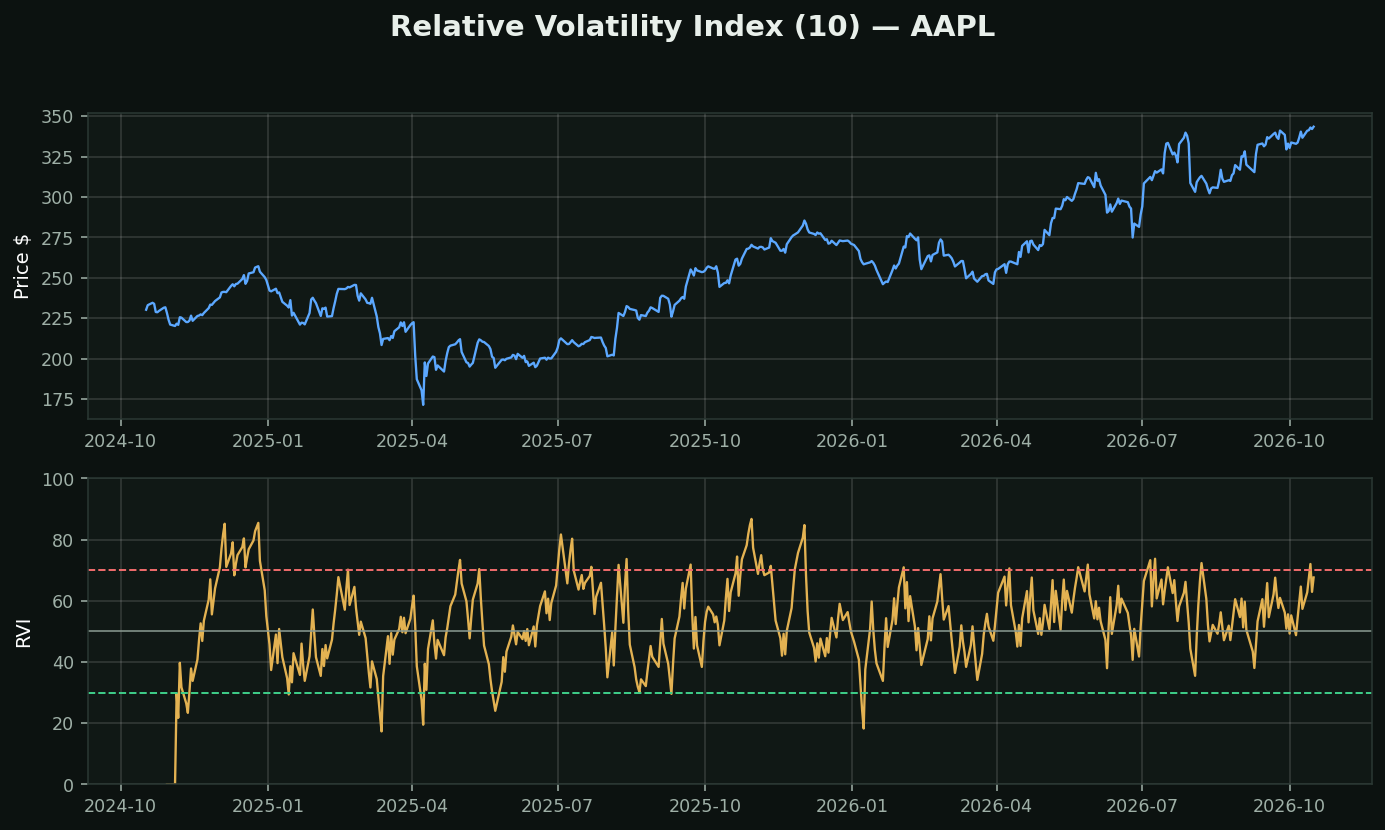
What it is: RSI, with standard deviation substituted for price change. Donald Dorsey, 1993. Instead of asking *how much did price rise versus fall*, it asks was volatility higher on up days or on down days.
Why that question is worth asking: volatility is not symmetric. Markets fall faster than they rise — a truth so reliable that the entire options skew is priced around it. When RVI is high, the big range days have been the UP days, and that is unusual enough to mean something.
The use Dorsey intended, and it is not the obvious one: he built it as a confirming filter, never as a standalone signal. His rule was to take a buy from your existing system only if RVI is above 50, and a sell only if below 50. It is a second opinion from a genuinely independent angle, which is rare on a chart where everything correlates.
That independence is the real value. MACD, ROC, CCI and the rest are all functions of closing price and correlate around 0.8 with each other. RVI is a function of *dispersion*. It can disagree with all of them at once, and a disagreement carries information that a sixth agreeing momentum study never will.
Do not confuse it with the Relative Vigor Index, which shares the abbreviation and measures close-versus-open.