Psychological Line
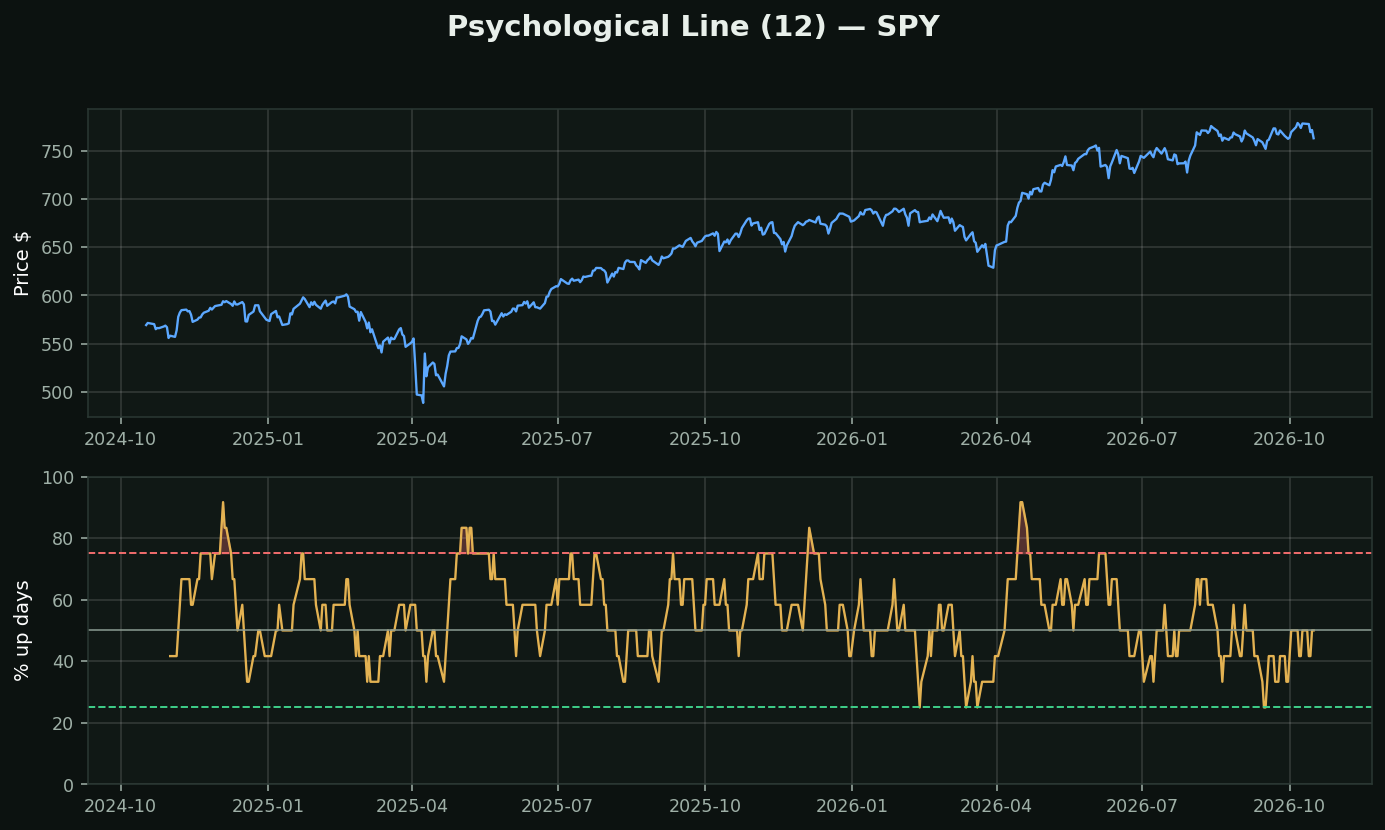
What it is: the percentage of the last 12 days that closed up. That is the entire calculation — count the green days, divide by twelve. Popular in Japanese and Chinese technical analysis.
What it deliberately throws away: the SIZE of every move. A day that rose 0.05% and a day that rose 9% both count as one. Every other momentum study in the library treats that as the important information.
Why discarding it can be the right call: this is measuring a behavioural fact rather than a financial one. People anchor on streaks, not on cumulative percentage. Ten green days in a row feels like an unstoppable rally even if the stock is up 2%, and that feeling is what drives the late buyer in. PSY is a crowd-mood reading dressed as a price indicator.
How it is read:
• Above 75 — nine or more up days in twelve. Rare, and the traditional fade
• Below 25 — three or fewer. Traditional accumulation zone
• Around 50 — normal, and it is here most of the time
Its real strength is what it is immune to. One enormous gap distorts RSI, ROC, MACD and every average on your chart. PSY does not notice — it is one day, same as the rest.