Price Volume Trend
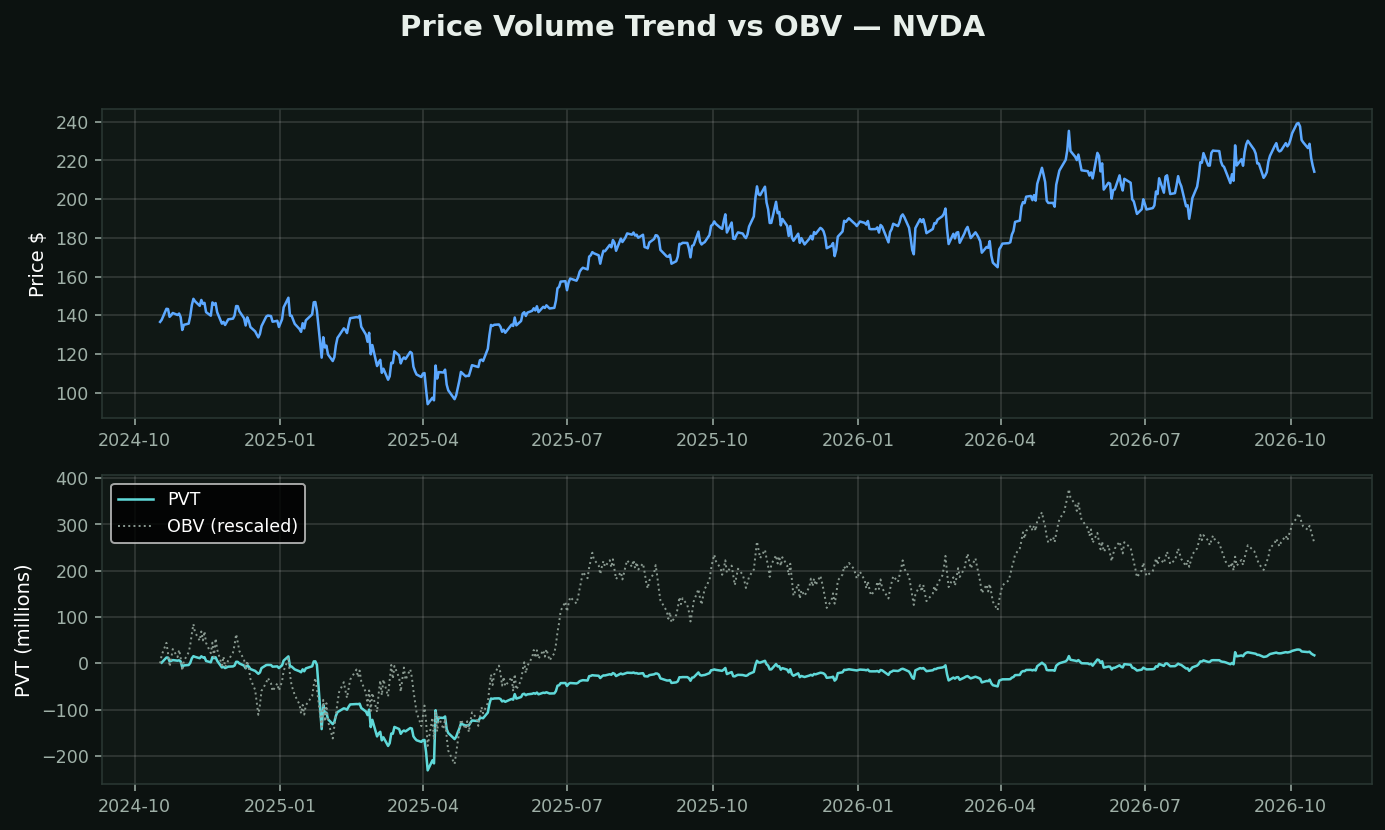
What it is: OBV with one change — instead of adding the whole day's volume, it adds volume times the PERCENTAGE the stock moved. A day that rose 4% contributes four times what a 1% day does.
Why that single change matters: OBV treats a 0.1% drift and an 8% gap as the same event. That is a real defect, not a stylistic choice. Under OBV, twenty quiet up-days on light volume can completely offset one enormous down-day on record volume — and the twenty quiet days were not the important information.
What PVT is really measuring: something close to money flow in and out, weighted by conviction. It is the version of OBV that survives contact with a volatile stock.
How traders use it:
• Divergence — price making new highs while PVT flattens means the new highs are coming on smaller moves and less volume
• Confirmation — PVT and price making highs together is the unremarkable, healthy case
• Never the level. Like every running total here, the number depends entirely on the day you started counting
Honest placement: PVT is a strict improvement on OBV and is far less popular. If you run OBV out of habit, this is the same habit with better arithmetic.