Mass Index
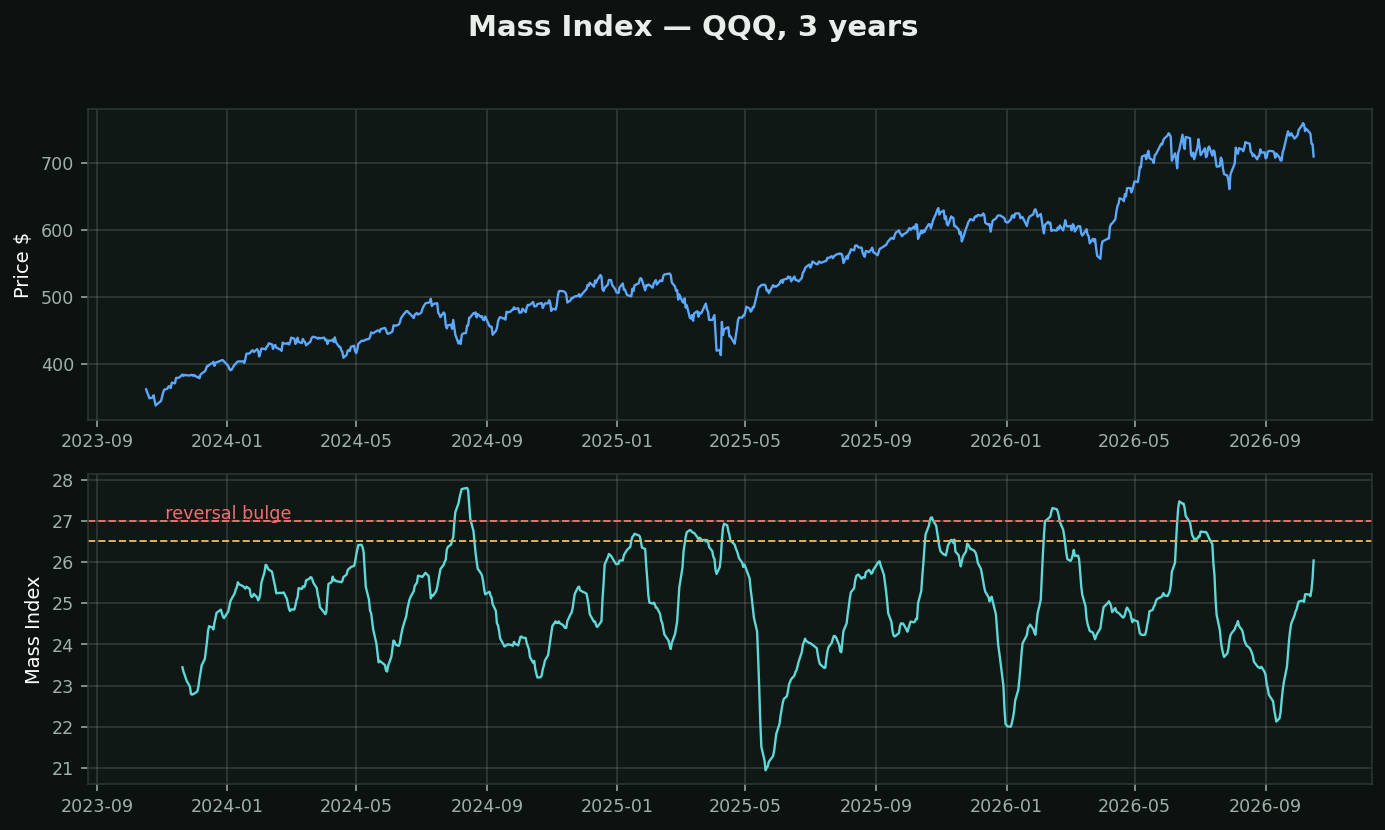
What it is: Donald Dorsey. Take a 9-day average of the daily range, then a 9-day average of THAT, and divide the first by the second. Sum 25 of those ratios. What you are measuring is whether the daily range is widening relative to its own recent norm.
What makes it unusual — it has no direction at all. Not 'non-directional' in the sense that you infer direction elsewhere. The formula contains no closing price and no sign. It cannot tell up from down even in principle.
What it claims to find: ranges expand before trends reverse. A stock in a healthy trend has orderly bars; before it turns, the bars get wide and erratic as the two sides fight. Dorsey's signal is the reversal bulge — the index rising above 27 and then dropping back below 26.5.
On this chart that fired 0 times in three years, marked in amber. Whichever way price was going, expect the other.
How to use it honestly: it flags *a reversal is likely*, and you must get direction from something else — the trend it would be reversing. Those thresholds, 27 and 26.5, are Dorsey's by inspection with no derivation, and they are not scale-free across instruments. Check them against the chart you are on before trusting them.