Market Facilitation Index
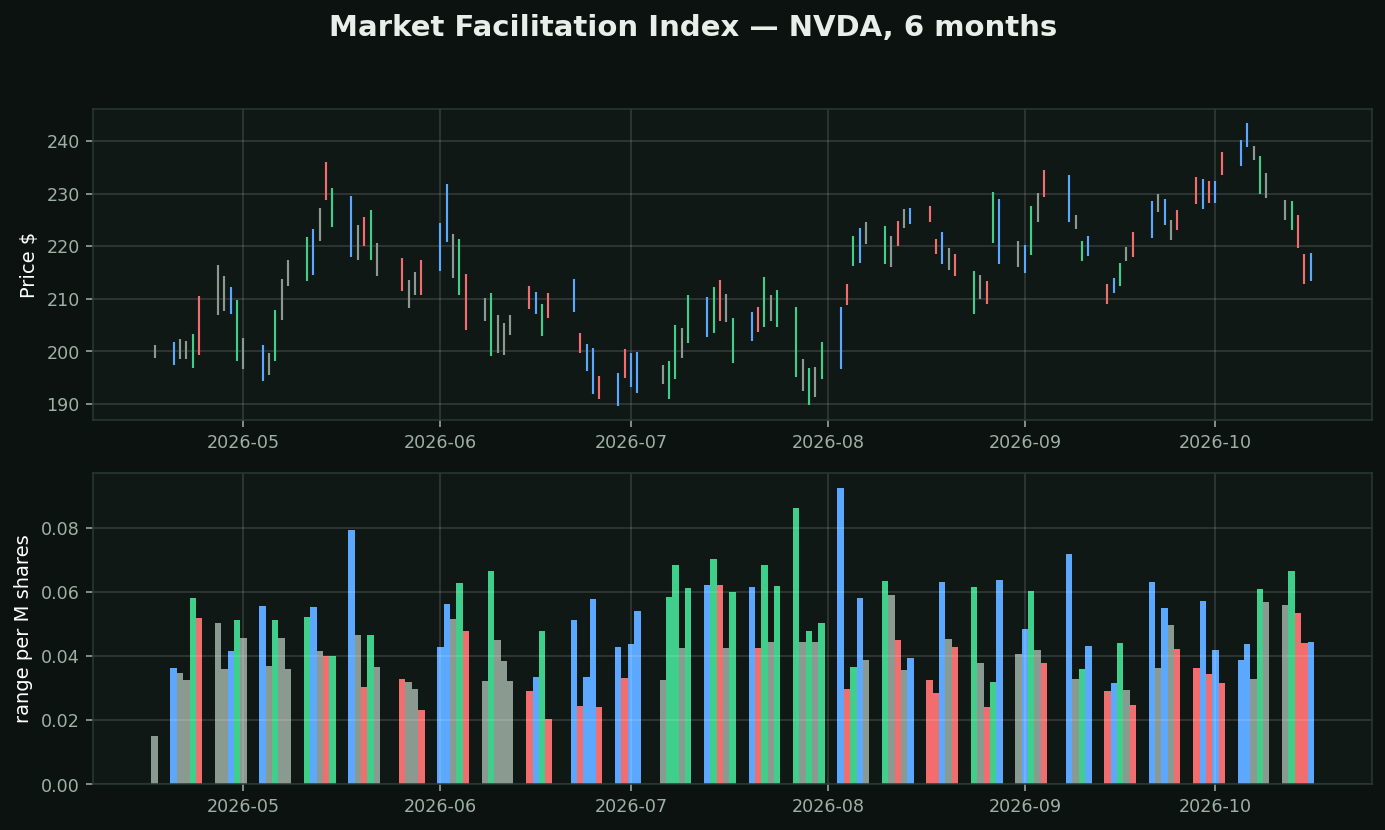
What it is: the day's range divided by the day's volume — how much price movement each share of volume bought. Bill Williams. Not to be confused with the Money Flow Index; they share initials and nothing else.
Why it is different from everything else here: it is not a running total and not an oscillator. It produces a classification. Compare today's MFI to yesterday's, and today's volume to yesterday's, and you get four states:
• Green — range up, volume up. Real participation, a move with people behind it
• Fade — both down. Nobody cares; the move is running out
• Fake — range up, volume DOWN. A big move on nobody. Easily reversed
• Squat — range down, volume UP. Huge volume going nowhere: someone large is absorbing everything. Often precedes the real move
On this chart: Green 28 · Fade 39 · Fake 32 · Squat 28. Bars are coloured by state.
Squat is the one to learn. Heavy volume with no price progress means a big seller is being met by a big buyer. When one of them finishes, price goes — and unlike most of this category, it tells you something is coming before it happens.