MACD
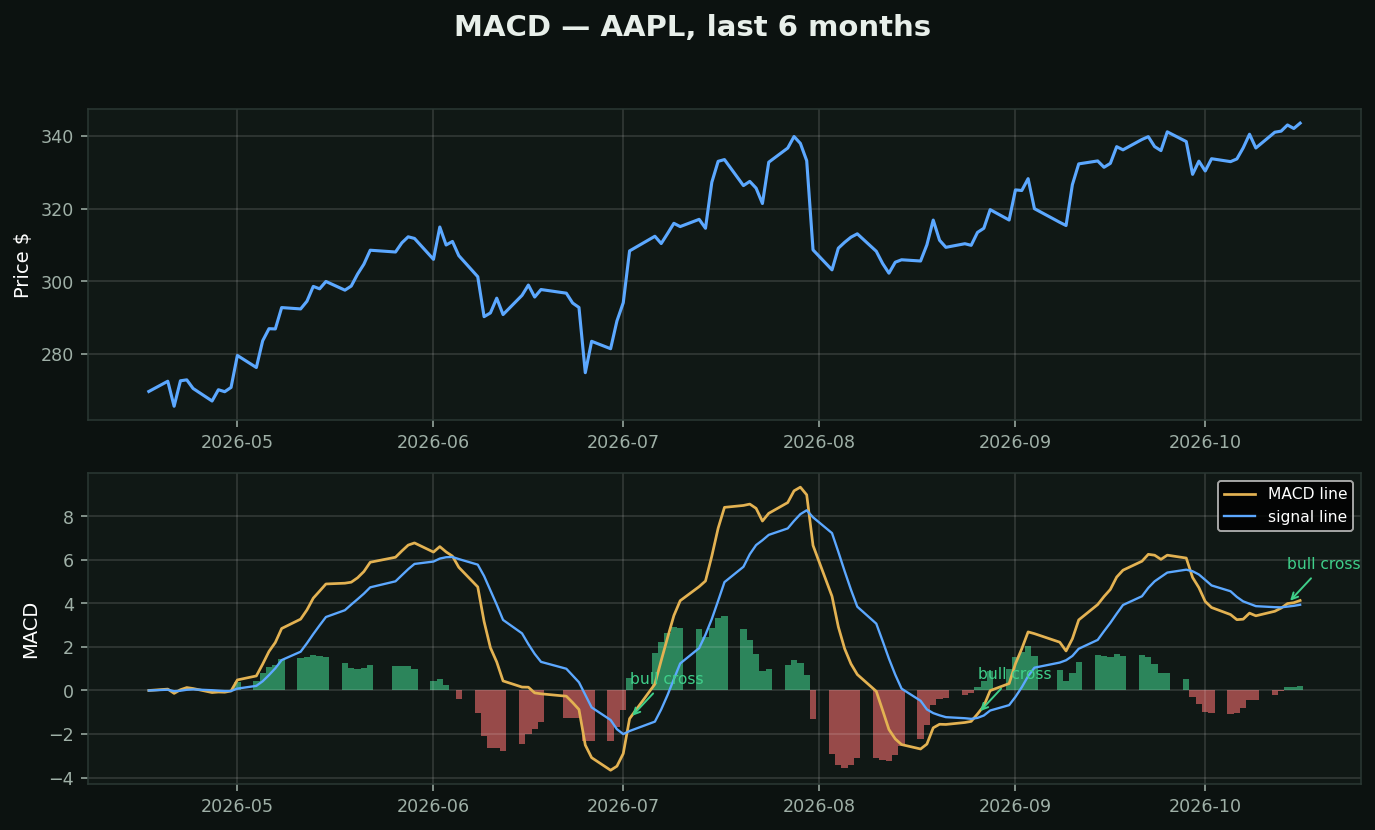
What it is: a momentum tracker built from two moving averages. The MACD line measures short-term vs long-term momentum; the signal line smooths it.
How to read it:
• MACD crosses ABOVE signal = momentum turning up (bullish cross — arrows on chart)
• MACD crosses BELOW signal = momentum rolling over
• Histogram bars (green/red) = the gap between them — shrinking bars warn the trend is tiring
How traders use it: trend confirmation. Price making highs while MACD makes lower highs = divergence, a classic early warning.
Chart: AAPL with MACD below — bullish crosses marked.
What testing here found: be careful with the cross. Over 413,946 stock-days, trend-following conditions ran BACKWARDS at a 21-day horizon — price above its moving averages preceded -0.46% (t=-4.40) while downtrend preceded +1.14% (t=+6.02). The engines here had to invert exactly that leg. Use MACD to describe momentum, not to time entries.