Reading an income statement
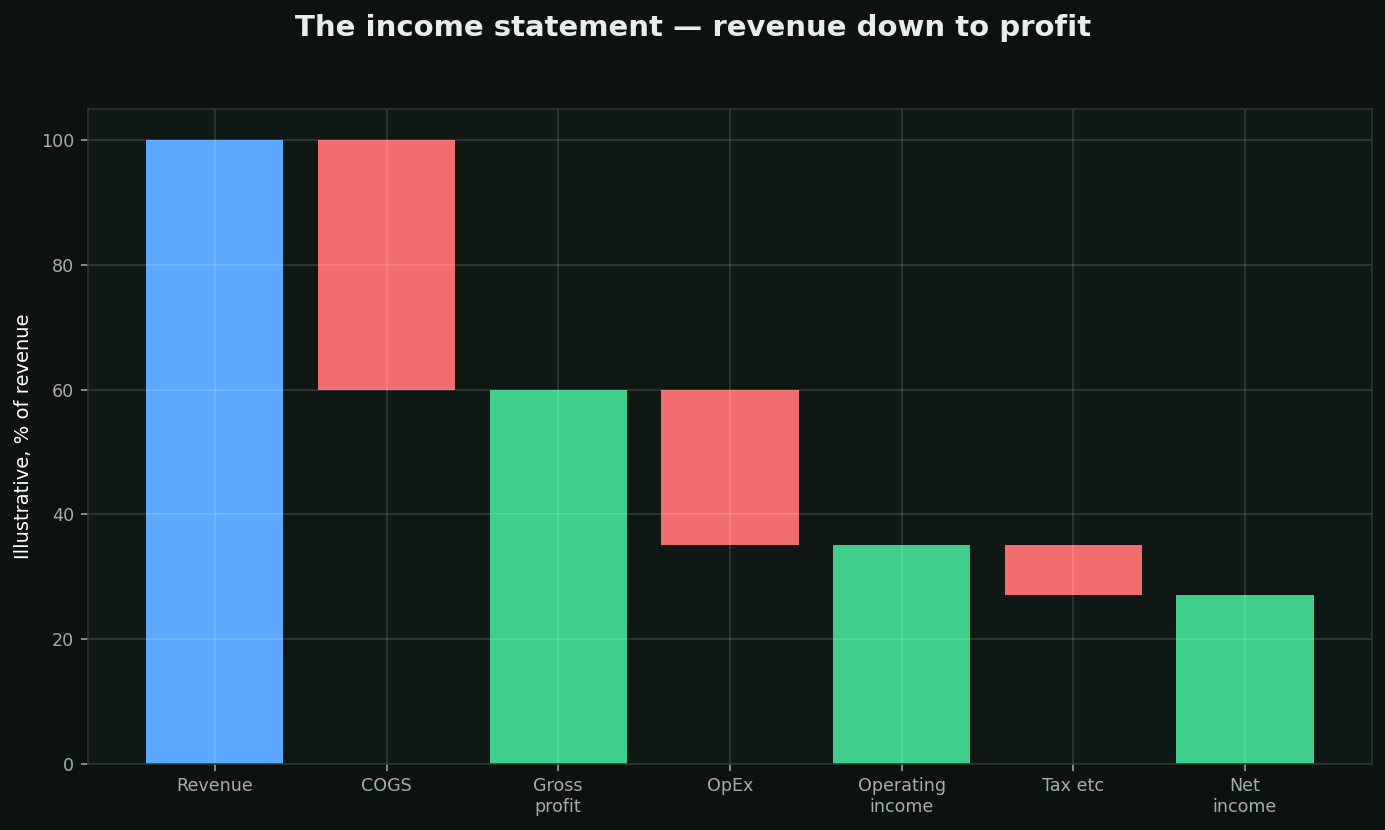
What it shows: performance over a PERIOD — a quarter or a year. It starts with revenue and subtracts its way to profit.
The lines that matter:
• Revenue — what was sold. Not cash received.
• COGS — the direct cost of producing it
• Gross profit — revenue minus COGS. Gross margin is pricing power in one number.
• Operating expenses — R&D, sales, admin
• Operating income — profit from the actual business, before financing and tax. Often the truest line.
• Net income — the bottom line, and the most easily massaged
What to look for: margins over time, not levels. A gross margin sliding three quarters in a row says more than any single number.
Chart: the walk from revenue to net income.