High Low Bands
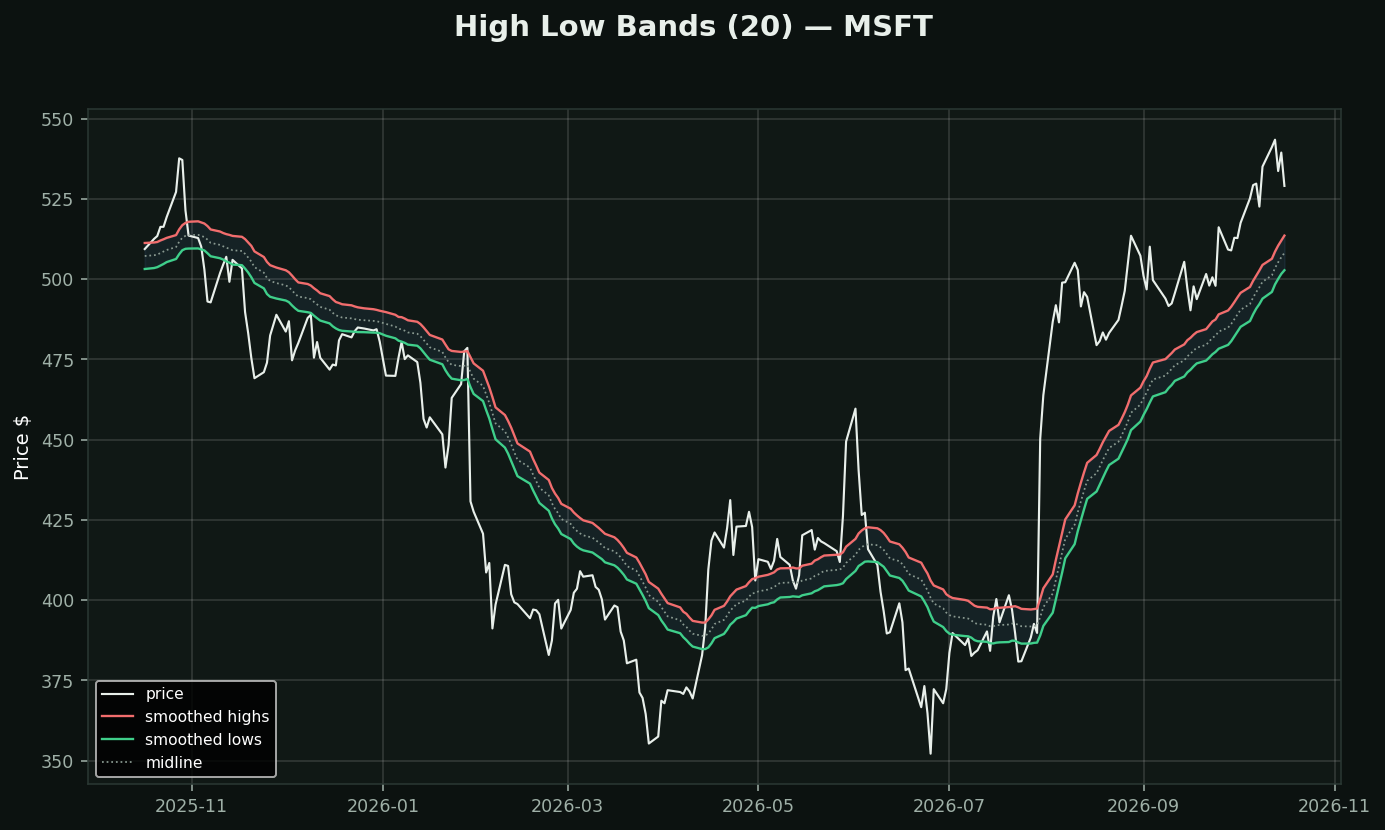
What it is: a smoothed average of the HIGHS as the upper band and a smoothed average of the LOWS as the lower band. No multiplier, no standard deviation, no ATR — just the two ends of the bar, averaged separately.
Why that is a real distinction: every other band study builds a centre line from closing prices and then constructs width around it with a formula. This one never computes a centre at all. The width emerges from how far apart the highs and lows have actually been running.
What that makes it good at: it is a literal picture of the trading range, with no parameter deciding what counts as stretched. There is no 2σ, no 2×ATR, no 3% to argue about — so there is nothing to curve-fit. Any band study with a multiplier can be tuned until it looks brilliant on the chart you are showing. This one cannot.
Where it falls down: it has no concept of an outlier. One enormous spike drags the smoothed high up for weeks, and the band stays wrong until the smoothing works it out.
How traders use it: the bands as dynamic support and resistance, and the midline as a mean-reversion target. It is Donchian with smoothing instead of hard extremes — same family, gentler.