Fractal Chaos Bands
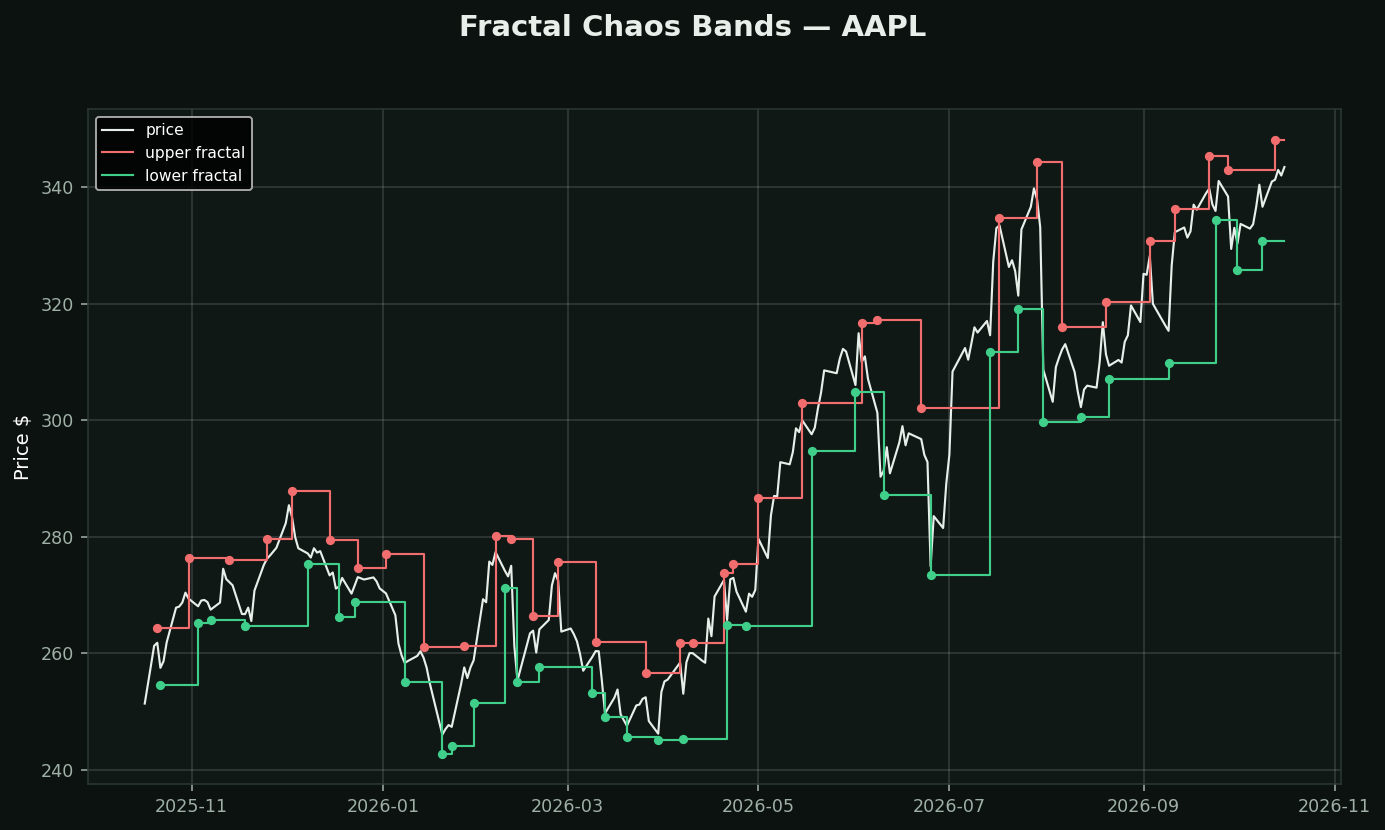
What it is: Bill Williams' fractals. A bar is an upper fractal if it has two LOWER highs on each side — a local peak confirmed by five bars. Lower fractals are the mirror image. Connect the most recent of each and you have the bands.
The names are borrowed, not earned. 'Fractal' in mathematics means self-similarity across scales. 'Chaos' means deterministic systems with extreme sensitivity to starting conditions. Neither concept is used in this calculation. It is a five-bar local-maximum test wearing the vocabulary of two unrelated fields — which is the most common way a study borrows credibility it has not got.
What is left once you strip the name, and it is not nothing: a completely mechanical definition of a swing high and swing low. No eyeballing, no drawing, no discretion. Two people running it on the same chart get the same levels, which is more than trendlines or head-and-shoulders can offer.
On this chart 68 fractals in a year.
The lag is structural and unavoidable. A fractal needs two bars AFTER the peak to confirm, so every level appears two days late, always. Use the bands as objective structure for stops and breakout definitions — not as signals.
What testing here found: this is a trend-following tool, and that family did not survive its own test. Over 413,946 stock-days, "price above its moving averages" preceded -0.46% at 21 days (t=-4.40) while downtrend preceded +1.14% (t=+6.02). Use it to describe a trend and to manage a stop — not to decide direction.