Fibonacci retracements
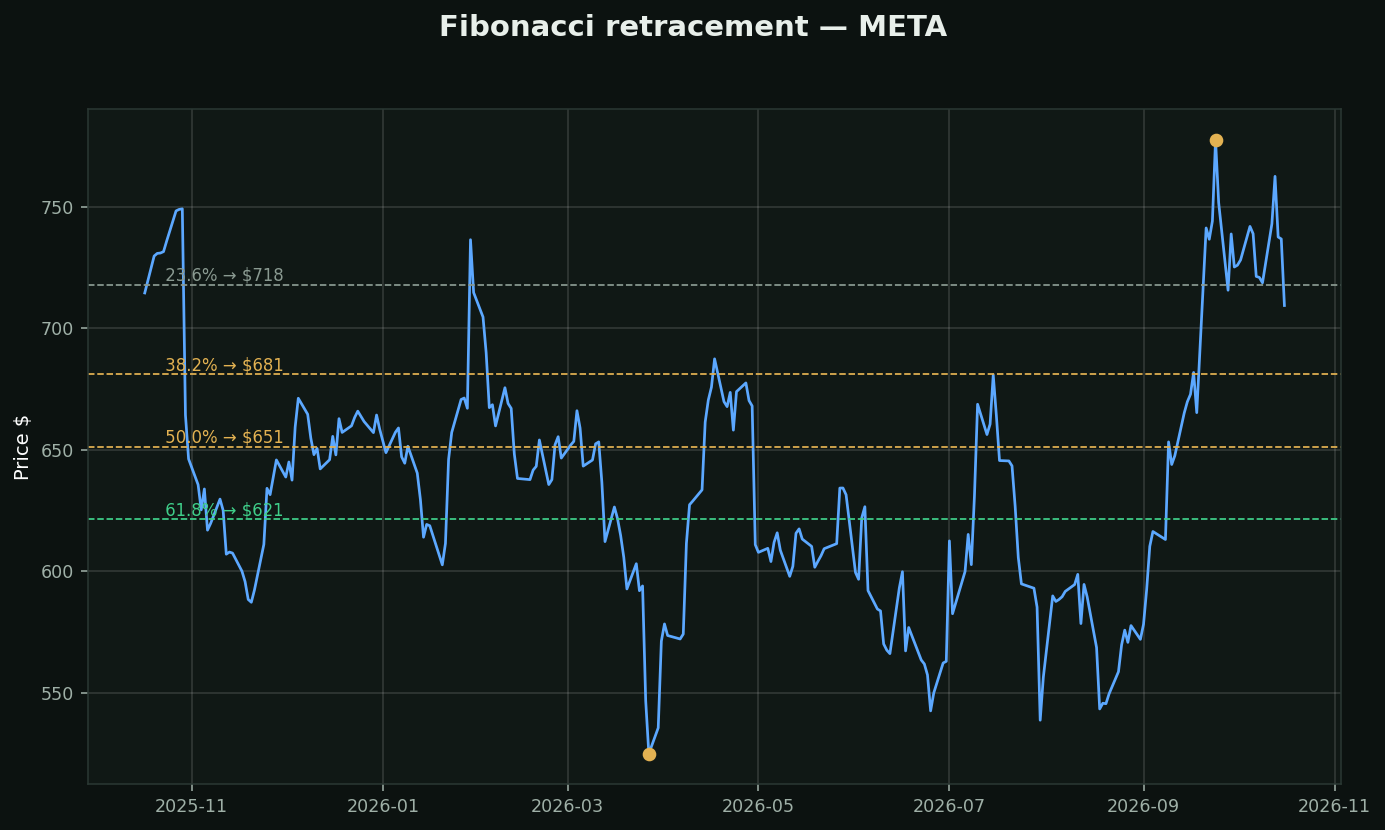
What they are: after a big move up, pullbacks tend to stop at predictable fractions of that move — 38.2%, 50%, 61.8% — before the trend resumes. The chart marks them from this stock's low→high swing.
How to read them:
• Shallow pullback (23-38%) = strong trend, buyers impatient
• The "golden pocket" (50-61.8%) = the classic dip-buy zone
• Losing 61.8% = the retracement is probably a reversal — get out of the way
The honest truth: there's no magic in the math — these work in part because MILLIONS of traders watch the same levels, which makes them real. Self-fulfilling is still fulfilling. Use as zones, not lines.