Fibonacci time zones
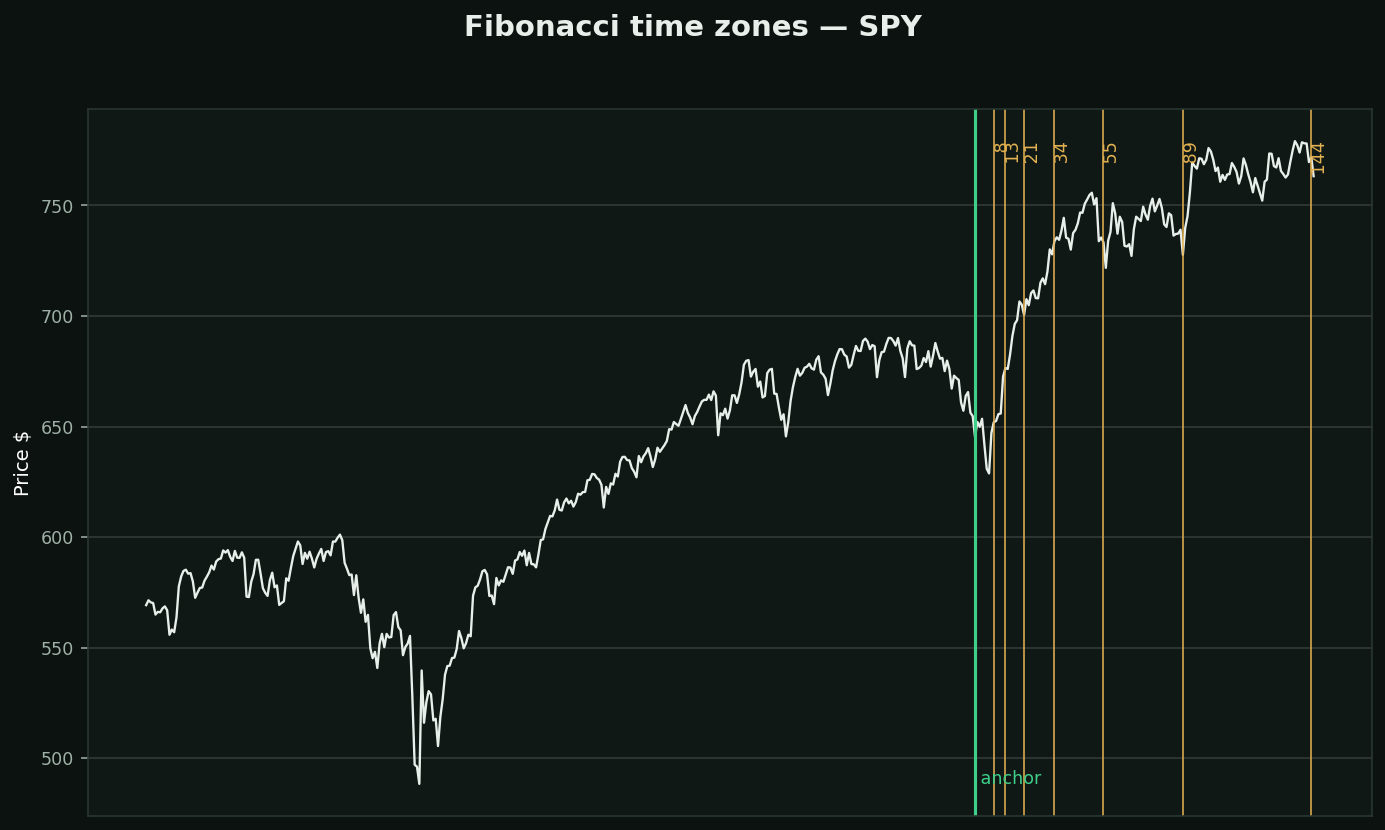
What it is: the same sequence applied to TIME rather than price. Anchor it at a pivot and it draws vertical lines 8, 13, 21, 34, 55, 89 and 144 bars later, marking dates a turn is supposed to be due.
What testing here found — and this one is more interesting than the price version. anomaly_scanner projected 340 bars from 48 pivots on SPY and measured how often a turn actually landed on one: 19.7% against a random-date baseline of 10.8%, a lift of +8.9 points. That is not nothing.
Then read the tool's own footnote. It tested 8 different counts and reports that the best of 8 beating the baseline by about 10 points is roughly what chance produces at that sample size. The winners were 13-day (+22) and 8-day (+20) — and with 8 tries, something had to come first.
That is the honest state of it: a lift that survives a single look and does not clearly survive the correction for having looked eight times. Worth watching, not worth trading yet.
It is also anchor-dependent. Move the anchor one bar and every projected date moves with it.