EPS & expected growth
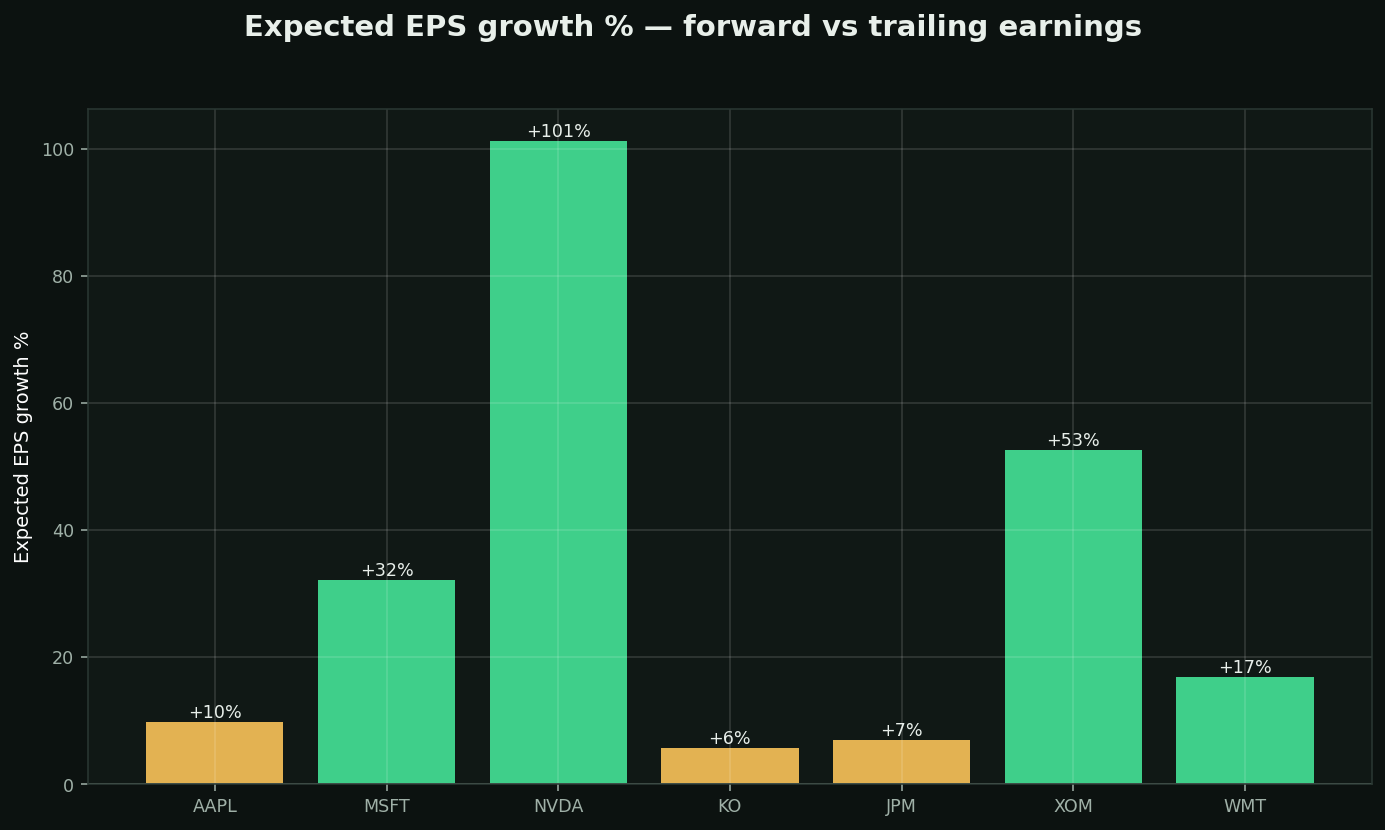
What EPS is: profit ÷ share count — YOUR slice of the earnings. It grows two ways: the business earns more, or the share count shrinks (buybacks). Both make your slice bigger.
The chart: what analysts expect next year's EPS to do vs the last twelve months. Green = double-digit growth expected; red = shrinkage.
Two things to always check:
• GAAP vs "adjusted" — companies love excluding inconvenient costs; the wider the gap, the more skeptical to be
• Dilution — if share count grows 8%/yr (heavy stock comp), the business must grow 8% just for YOUR slice to stand still
Stock prices follow EPS revisions more reliably than almost anything else.