Depreciation and amortisation
What it is: spreading the cost of a long-lived asset across the years it is used, rather than expensing it all at purchase.
The key property: it is a non-cash expense. It reduces reported profit without any money leaving. That is why it gets added back on the cash flow statement, and why EBITDA exists.
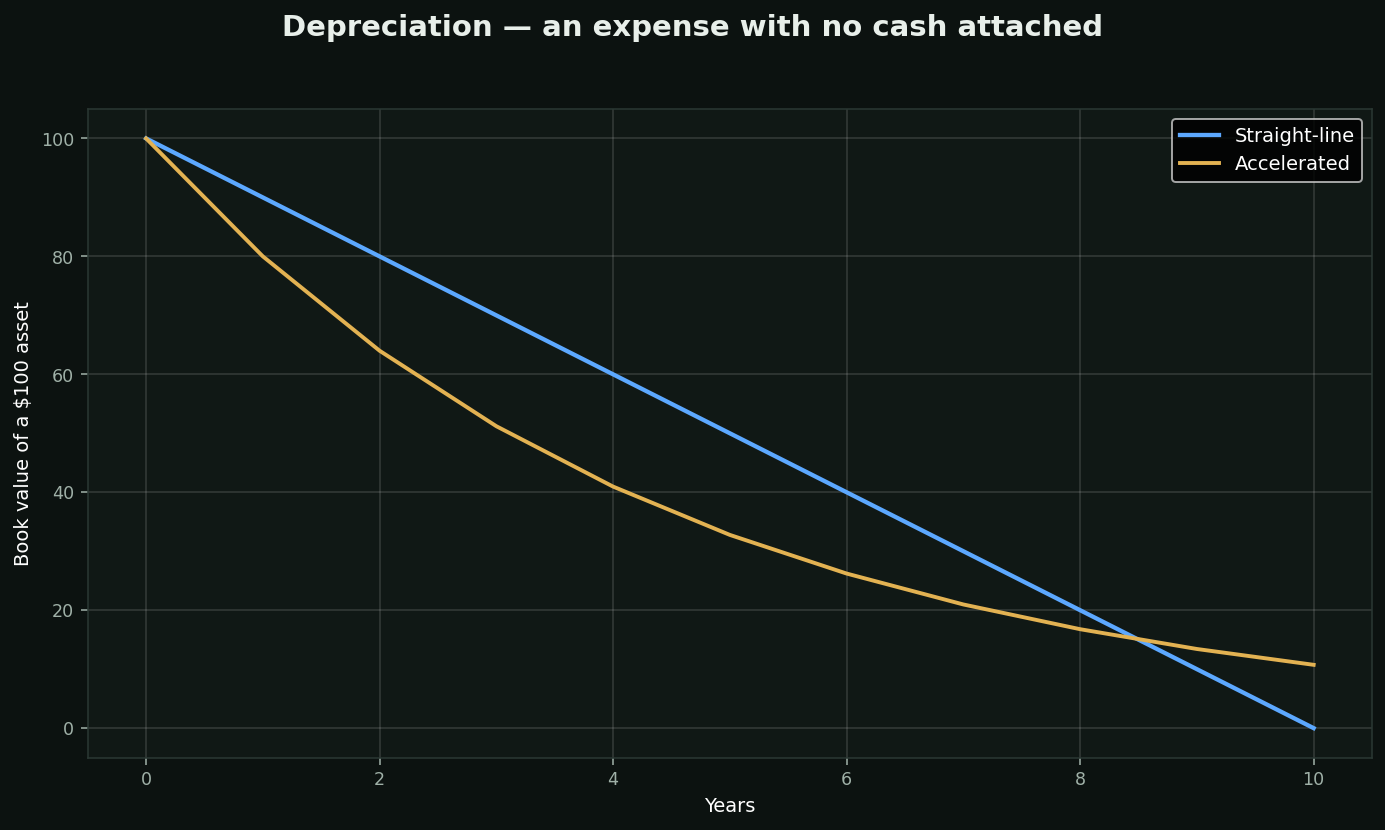
Why the method matters: straight-line spreads evenly. Accelerated front-loads the expense, lowering early profit and early tax. Two identical companies can report different profits purely from this choice.
Where it misleads:
• EBITDA ignores it entirely — fine for a software company, misleading for one that must constantly replace equipment
• A fully depreciated asset still works; book value hits zero while the machine keeps running
• Compare D&A against capital spending — if D&A greatly exceeds capex for years, the asset base is shrinking
Chart: the same asset, two methods.