Debt-to-equity
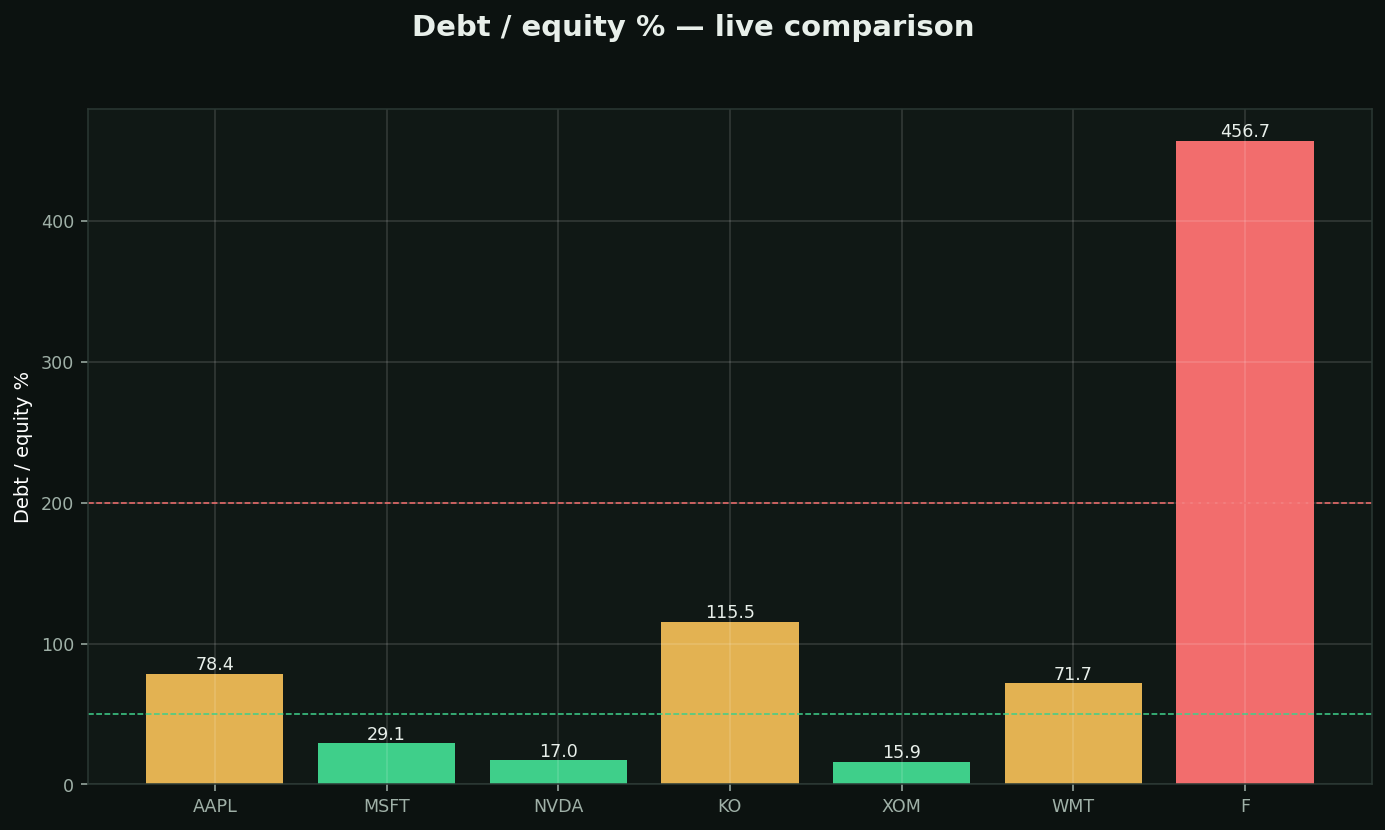
What it is: how much the company owes vs what shareholders own. Leverage — the thing that turns bad quarters into bankruptcies.
Rules of thumb:
• Under 50% (green) = fortress · 50-200% = normal for most industries
• Over 200% (red) = fragile — high rates or one bad year bite hard
• Banks/utilities run high by design — compare within industry
Why it matters MOST at the worst times: in booms, leveraged companies look like geniuses. In busts, debt is why some stocks fall 30% and others fall 90%. You don't get to add this filter *after* the crash starts.
Pair it with: interest coverage (can profits pay the interest bill several times over?).