The Darvas Box
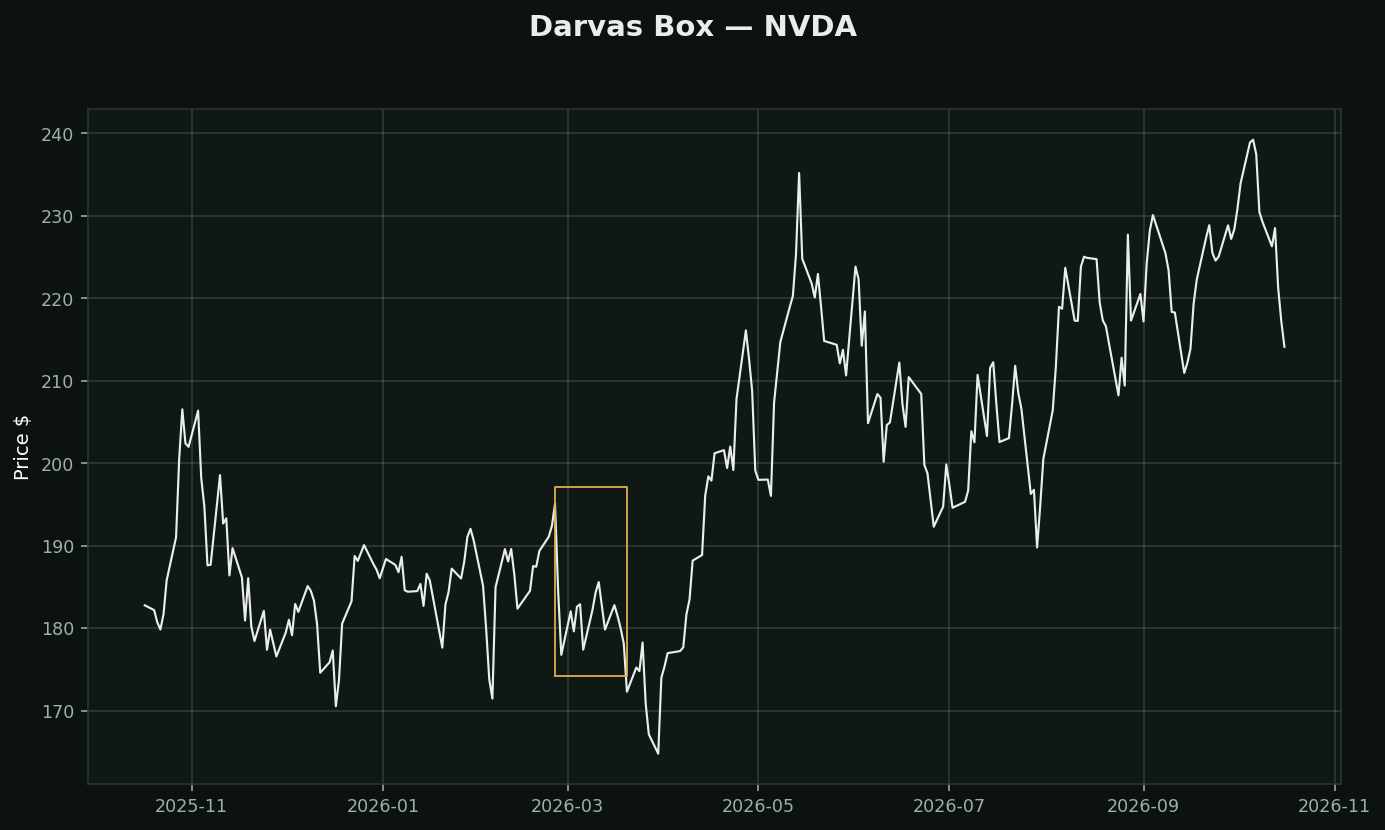
What it is: draw a rectangle around a consolidation. The top is a high that held for three sessions; the bottom is the low that held underneath it. Buy a break above the box, and your stop is the bottom.
Where it came from: Nicolas Darvas was a professional ballroom dancer touring the world in the 1950s. He had no access to news and could only receive weekly cables with prices. That constraint is the entire method — he could not react to headlines, so he built a rule that only needed price and only needed checking occasionally.
What is genuinely good about it, still:
• The stop is defined before entry and by the market's own structure, not a round percentage
• The risk-reward is knowable at the moment you buy
• It forces patience — most weeks there is no box to trade
What to be honest about: the boxes on this chart are drawn by a mechanical rule. Drawn by hand, by eye, after the fact, the technique looks far better than it is, because you will find the boxes that worked. Any pattern method that needs a human to decide what counts cannot be tested, and an untestable method is a story.
And the base rate matters: breakouts from consolidation are the trend-following family, which this toolkit measured and had to invert.
What testing here found: this is a trend-following tool, and that family did not survive its own test. Over 413,946 stock-days, "price above its moving averages" preceded -0.46% at 21 days (t=-4.40) while downtrend preceded +1.14% (t=+6.02). Use it to describe a trend and to manage a stop — not to decide direction.