Correlation
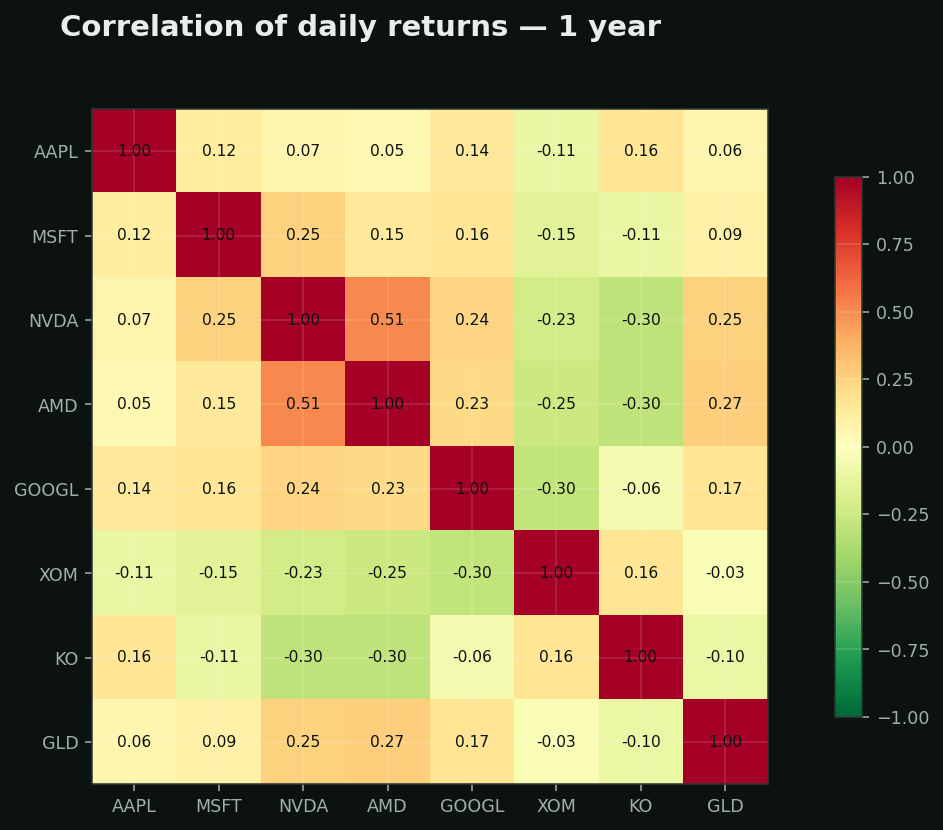
What it is: whether two things move together. +1 is lockstep, 0 is unrelated, -1 is exact opposites. Measured on daily RETURNS, not on prices — two stocks that both drift up over a year look correlated on a price chart even when their day-to-day moves are unrelated.
Why it is the most under-used number in retail investing: eight positions feels diversified. If six of them are correlated at 0.8+, you do not own eight positions — you own about two, at triple the position size you think. That is how a portfolio that looked sensible drops 30% in a week.
On this chart: NVDA and AMD run at 0.51. Buying both is not a hedge and is barely a second idea. Watch where GLD and XOM sit against the tech block — that is what actual diversification looks like as a number.
The catch nobody mentions: correlations go to 1 in a crash. The diversification you measured in calm markets is exactly the diversification that stops working on the day you need it.
How to use it: before adding a position, check its correlation to what you already own. If it is above 0.7, you are adding size, not adding an idea.