Chande Momentum Oscillator
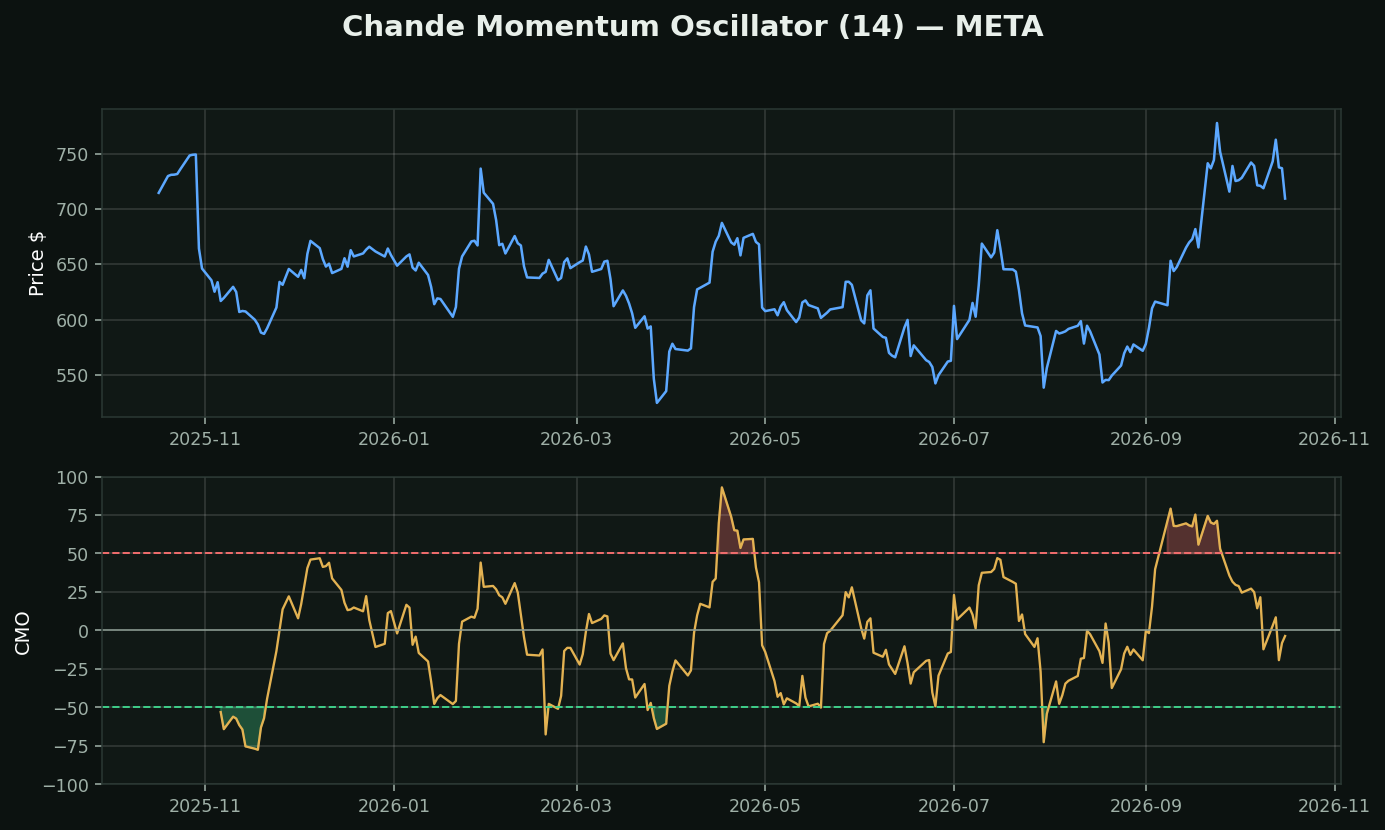
What it is: total up-moves minus total down-moves over 14 days, divided by the sum of both, times 100. Tushar Chande, 1994. Runs -100 to +100.
How it differs from RSI: RSI divides ups by (ups + downs). CMO uses (ups − downs) over (ups + downs) and skips Wilder's smoothing entirely. Unsmoothed means it reaches its extremes sooner and reverses harder — the same signal with the shock absorbers removed.
The one genuinely different use: because it is symmetrical around zero, the ABSOLUTE value of CMO is a clean trend-strength reading. |CMO| near 0 means ups and downs are cancelling — a range, regardless of direction. Chande built his Variable Index Dynamic Average around exactly this, speeding a moving average up when |CMO| is high.
How traders use it:
• ±50 as the stretch thresholds, ±70 for a harder filter
• |CMO| under 20 → chop; stand down the trend tools
• Divergence, as with every oscillator, is the highest-value read
What testing here found: the contrarian read on this family holds up. Across 413,946 stock-days, RSI-oversold names beat the base rate by +0.82% over the next 21 days (t=+4.09) and overbought names trailed by -0.58% (t=-4.27). Oscillators that measure stretch survived their test here; the trend-followers did not.