Candlesticks
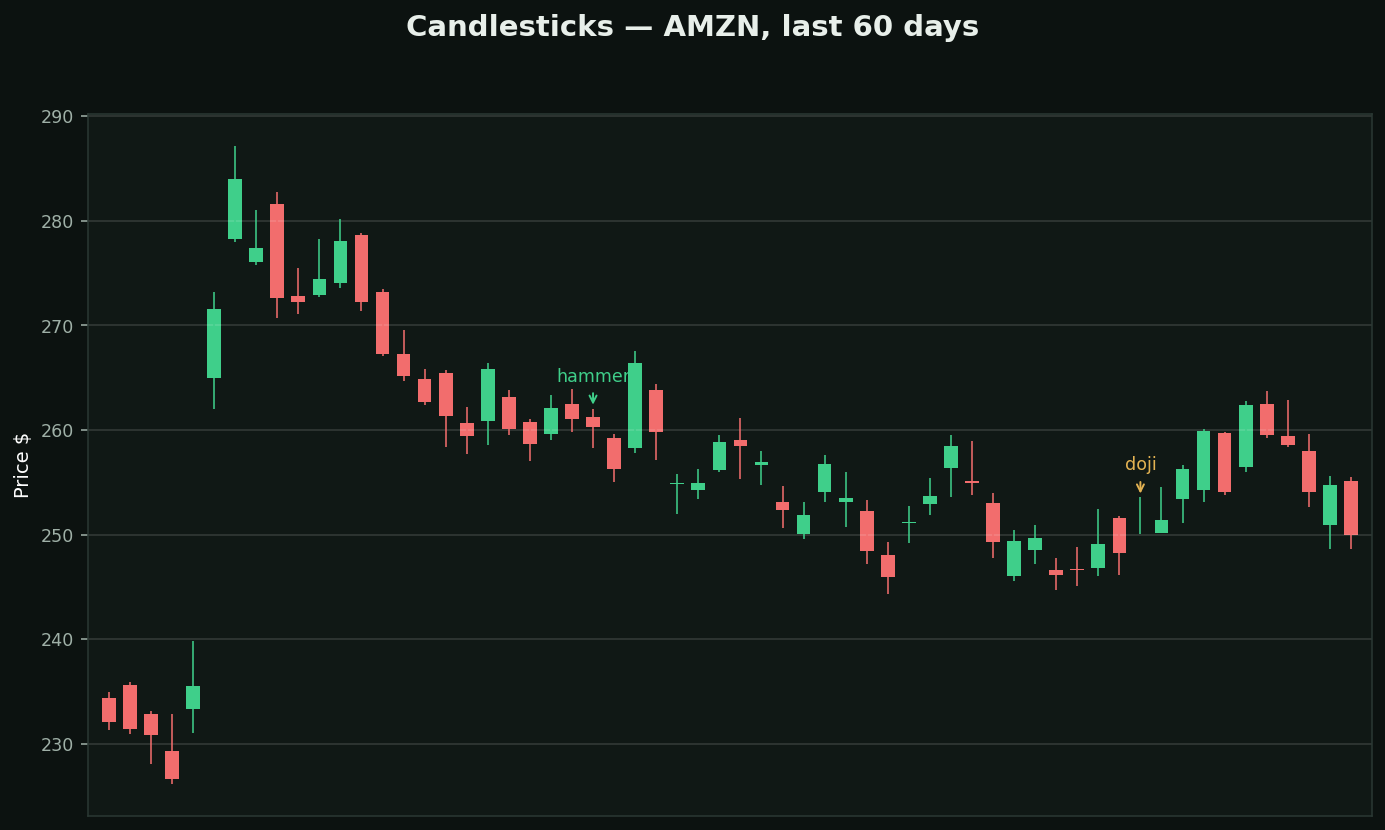
What they are: each candle shows a day's full story — open, close (the body), and the extremes (the wicks). Green = closed up, red = down.
The three shapes worth knowing first:
• Doji — tiny body: buyers and sellers fought to a draw. After a long trend, indecision is the first crack
• Hammer — long lower wick after a decline: sellers pushed price down and got overpowered. Rejection of lower prices
• Engulfing — a candle whose body swallows yesterday's entirely: momentum just changed hands
The rule that makes them useful: a candle means nothing alone — LOCATION is everything. A hammer AT SUPPORT is a signal; a hammer mid-range is noise.