Bollinger Bandwidth
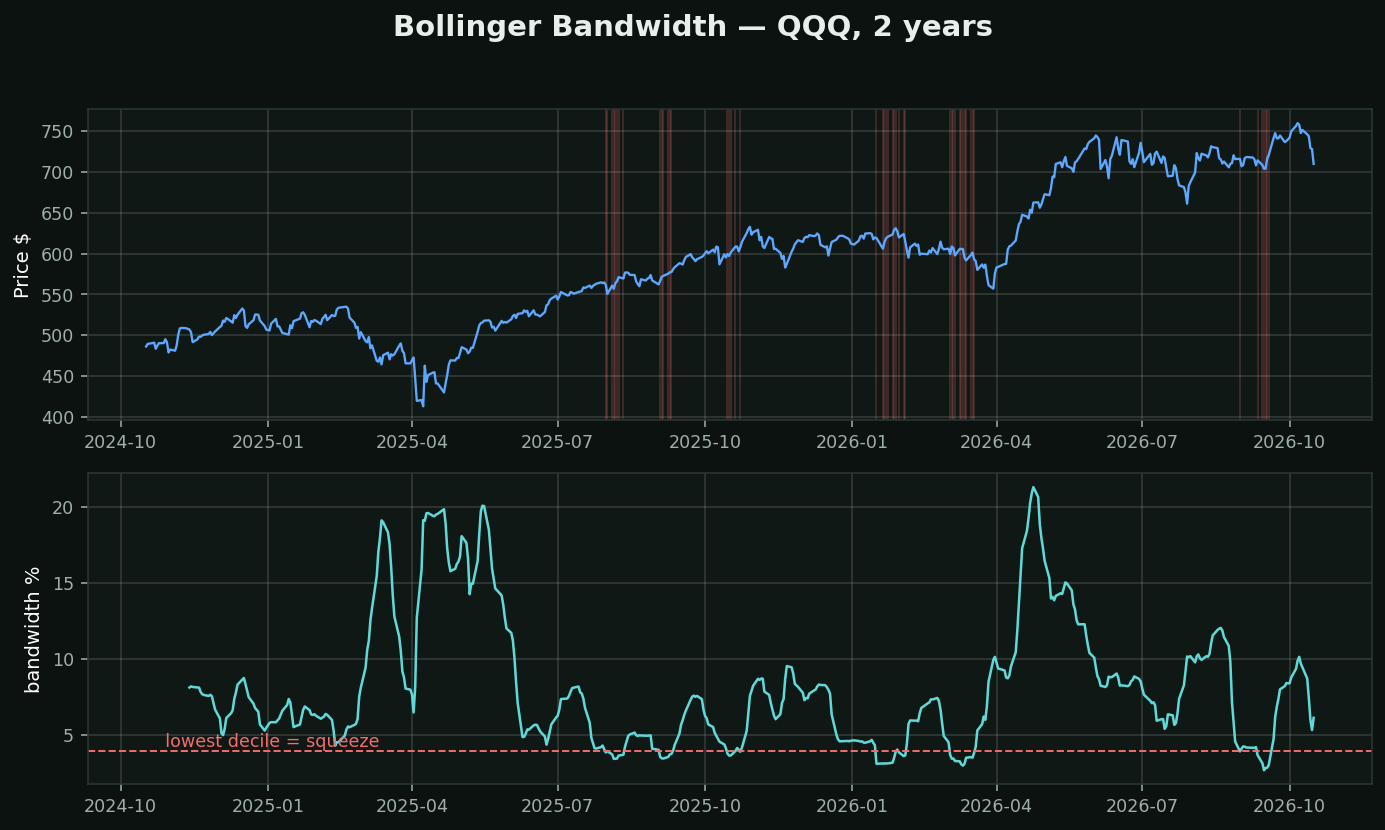
What it is: the distance between the Bollinger bands, divided by the middle band, as a percent. The squeeze — but as a NUMBER instead of a shape you have to eyeball.
Why that upgrade matters: "the bands look tight" is not something you can screen on, backtest, or set an alert for. Bandwidth is. It lets you ask a precise question — *is this stock in the quietest 10% of its own last two years?* — and get a yes or no.
How traders use it:
• Bandwidth at a multi-month low = the squeeze is on. Direction unknown, size of the coming move not unknown
• Bandwidth at an extreme high = the move is late, not early. This is where positions get closed, not opened
• Options are cheapest exactly at the bandwidth floor, which is the one moment the buyer and the chart agree
Chart: QQQ's bandwidth is 6.1% against a two-year floor of 3.9%. Red shading marks every day spent in that lowest decile — notice what tends to follow them.