Anchored VWAP
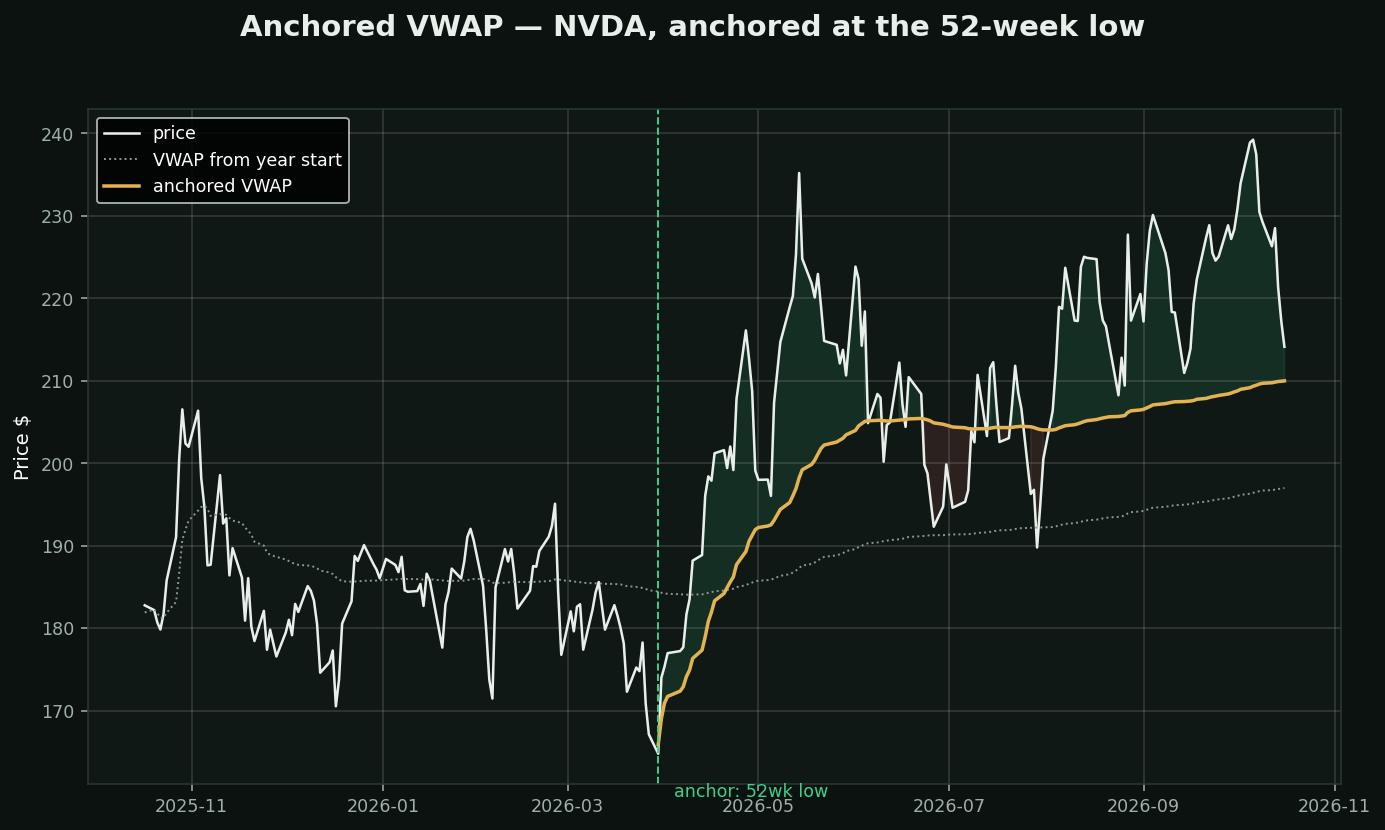
What it is: ordinary VWAP resets every session, which makes it a day-trader's tool. Anchored VWAP starts the calculation at a date YOU pick and never resets — so it answers a specific question: *what is the average price everyone who bought since that event has paid?*
Why it matters: it turns a line into a P&L statement for a whole cohort of holders. Price above the anchored VWAP means the average buyer since that event is up, and people who are up behave differently from people who are underwater and waiting to get out flat.
Where to anchor — always an EVENT, never a round date:
• an earnings gap · the day a CEO was replaced
• a 52-week high or low · the start of a squeeze
• the day an activist filed
Chart: NVDA anchored at its 52-week low. Price $214 is ABOVE the anchored VWAP of $210 — the average buyer since the low is up 2.0%.